My favorite app
Great app, easy to use. Helps our small business save time and money to create different marketing materials professionally. Thank you.
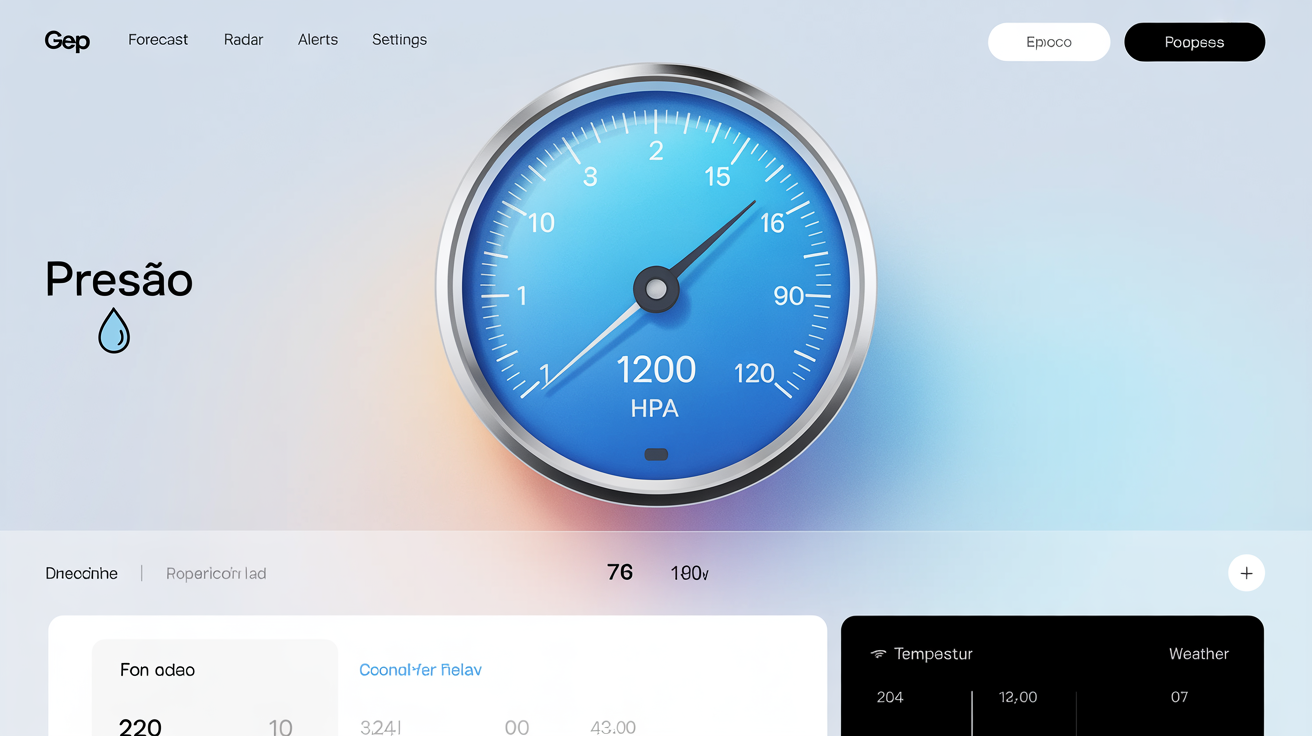
Start by writing a detailed description of the pressure gauge. Include style, colors, units, and the reading you want it to show.
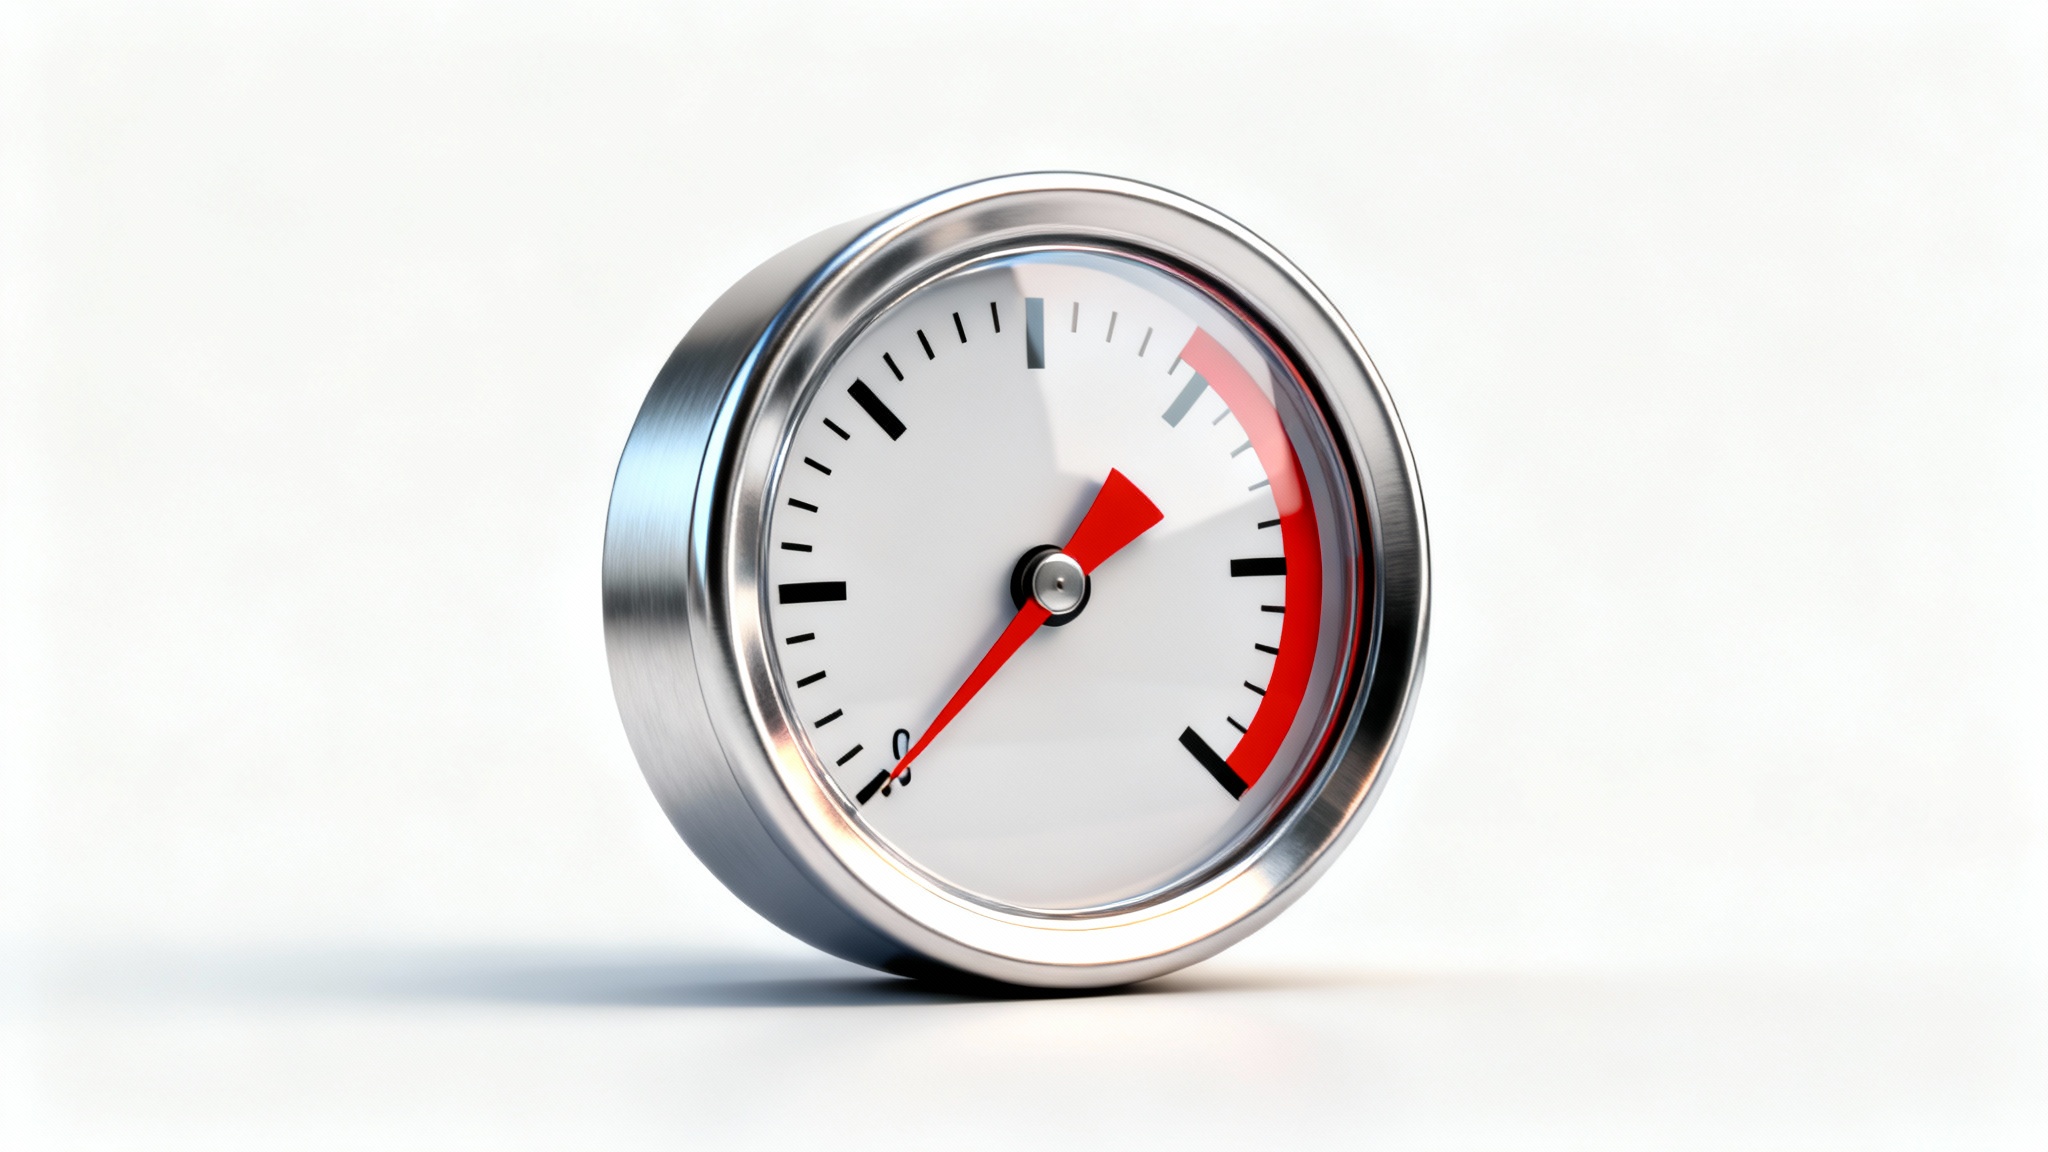
Our AI will process your prompt and create a unique pressure gauge graphic based on your description.
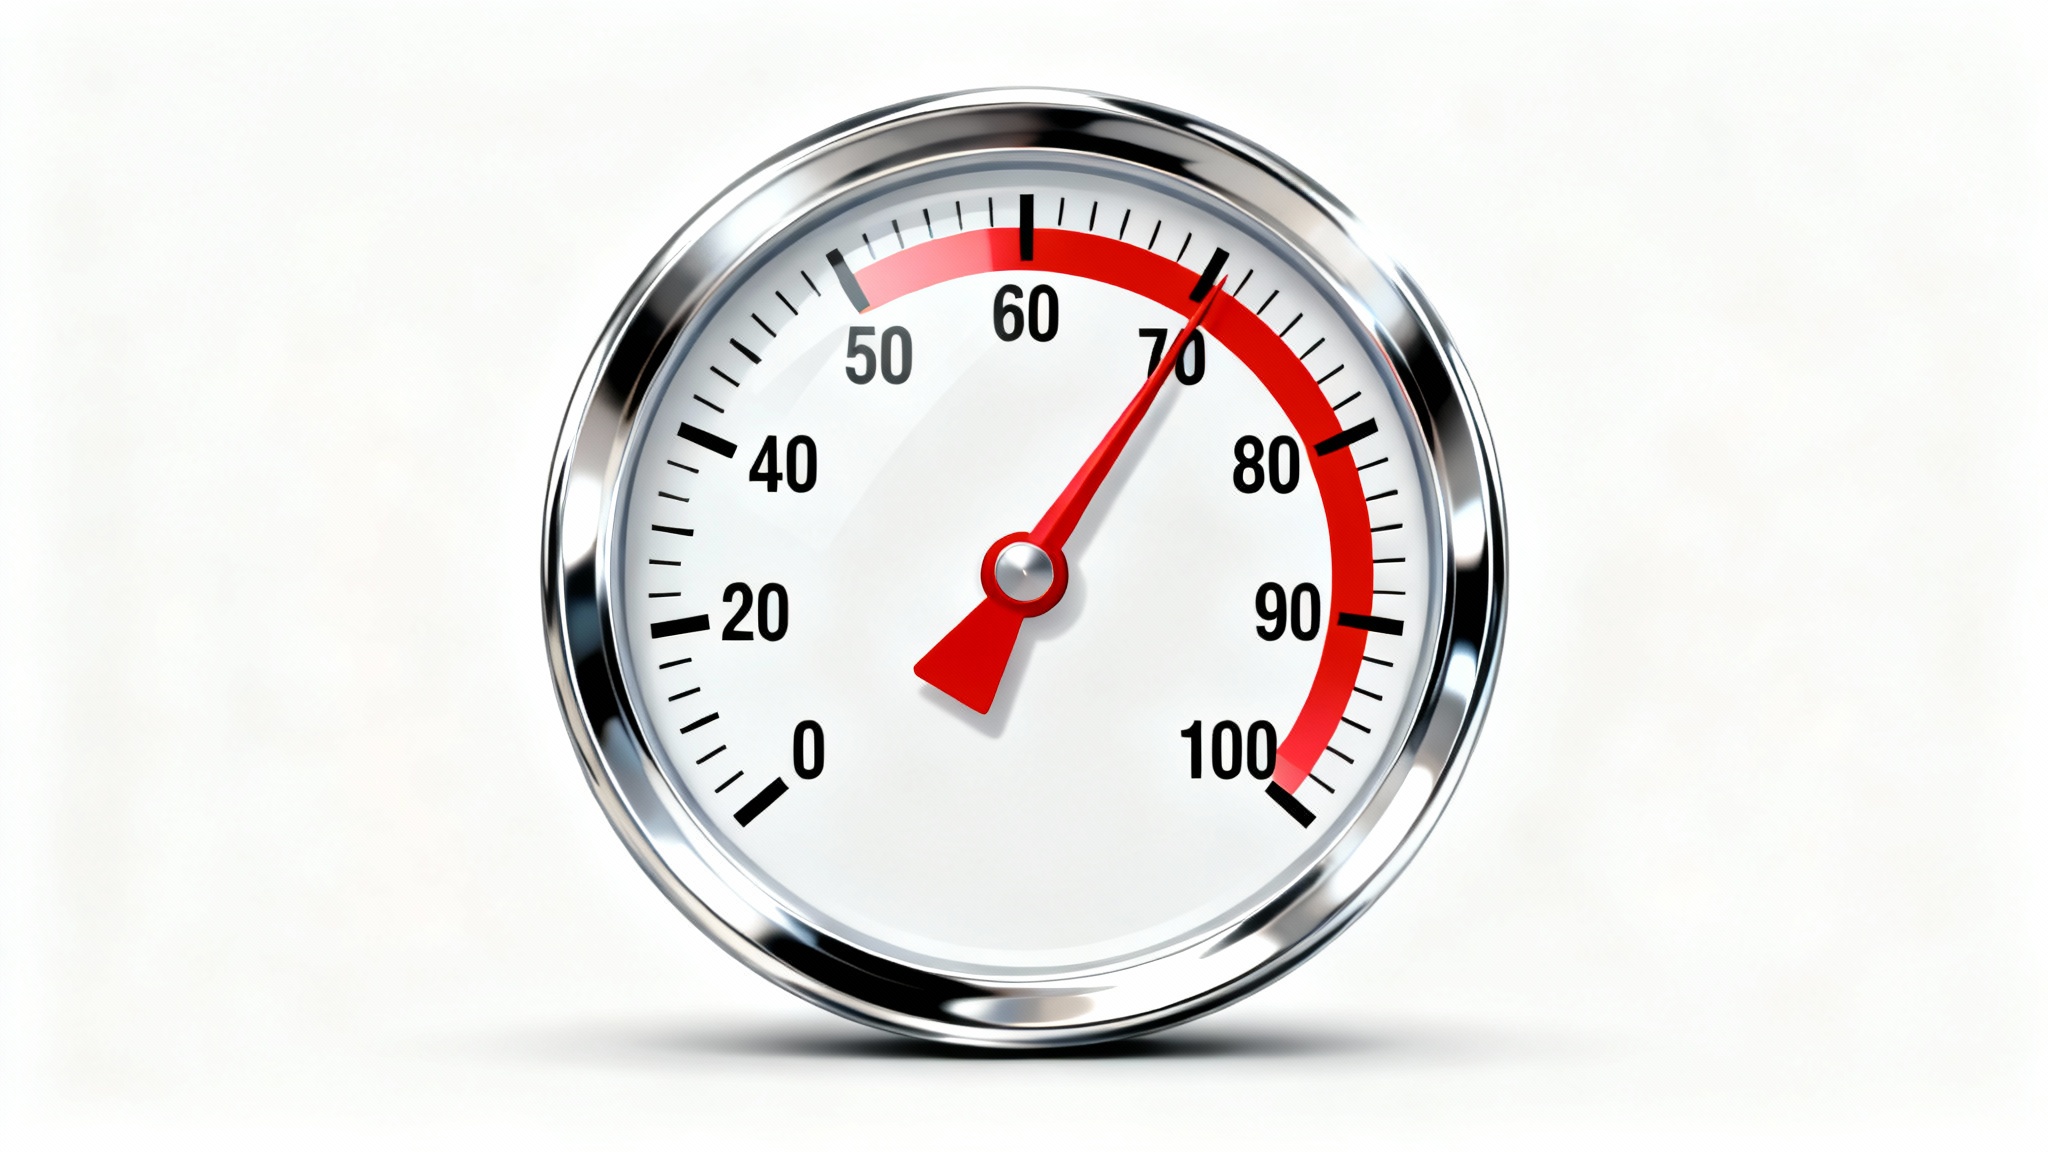
Your high-resolution pressure gauge graphic is ready to be downloaded for free and used in any of your projects.
An AI pressure gauge graphic generator is a tool that uses artificial intelligence to create images of pressure gauges from text descriptions. You can specify the style, reading, units (e.g., PSI, bar, hPa), and overall look to generate a custom visual.
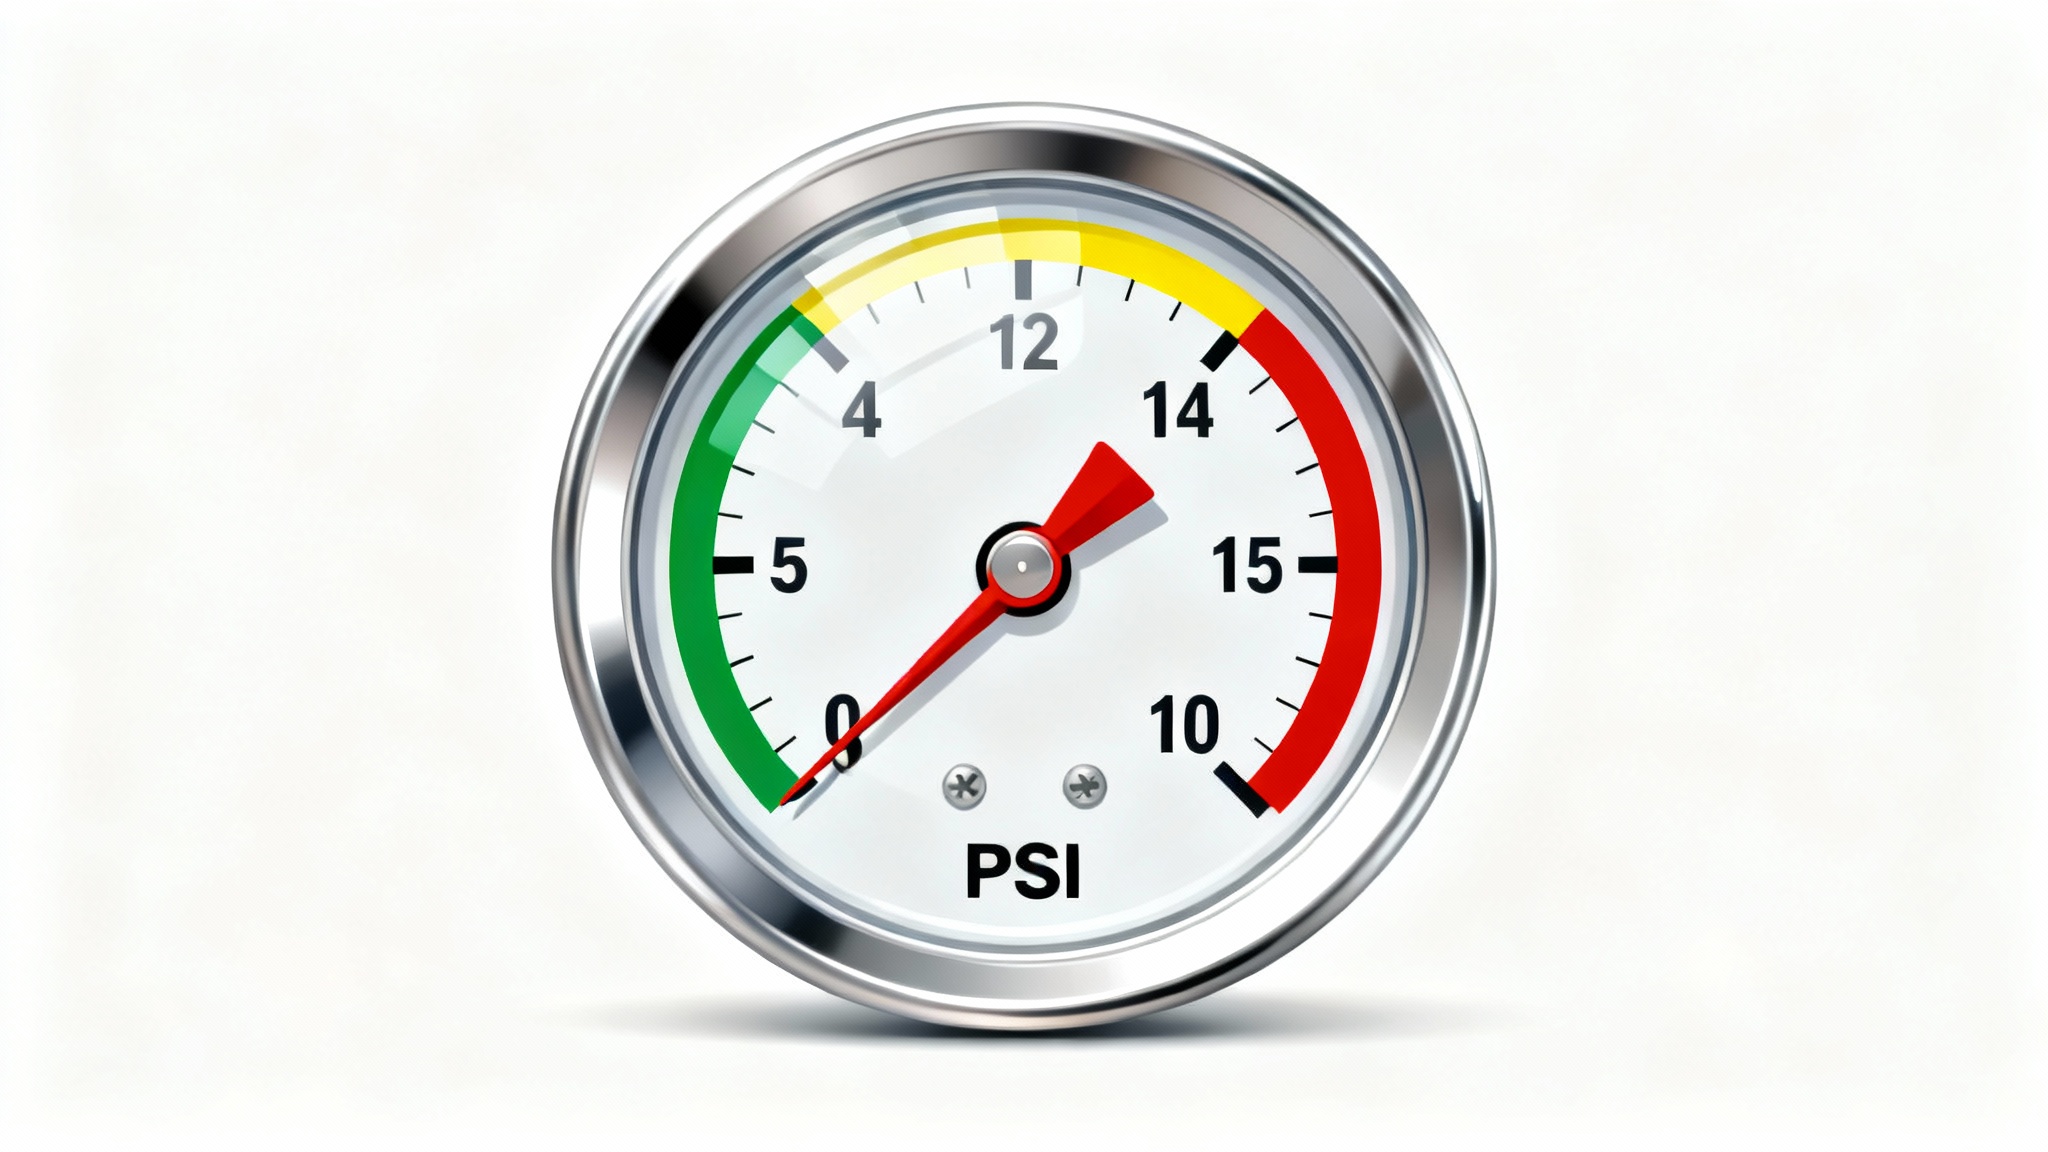
Yes, you can specify the exact reading you want the gauge to display in your text prompt. For instance, you could ask for 'a pressure gauge with the needle pointing to 60 PSI'.
You can create a wide variety of styles. Try describing a 'vintage brass steam pressure gauge,' a 'modern digital car dashboard gauge,' or a 'simple flat UI barometer graphic.' The AI will adapt to the style you describe.
Yes, the tool is free to try. You can generate and download your custom pressure gauge graphics in high-resolution PNG or JPEG formats for free. Pixelcut PRO users have access to additional formats.
No design experience is necessary. All you need to do is type a clear description of the gauge you envision. The AI handles the entire design process for you.
Yes, the graphics you create are watermark-free and can be used for both personal and commercial purposes, such as in presentations, applications, or marketing materials.
Great app, easy to use. Helps our small business save time and money to create different marketing materials professionally. Thank you.
I need a good background remover for my work and I've been through them all it feels like. This one is the best by far. It's so easy to use and the results always look amazing. Thank you Pixelcut!
It's amazingly easy and gives the perfect results for my bags and accessories. It looks like it was done by a professional photographer.