My favorite app
Great app, easy to use. Helps our small business save time and money to create different marketing materials professionally. Thank you.
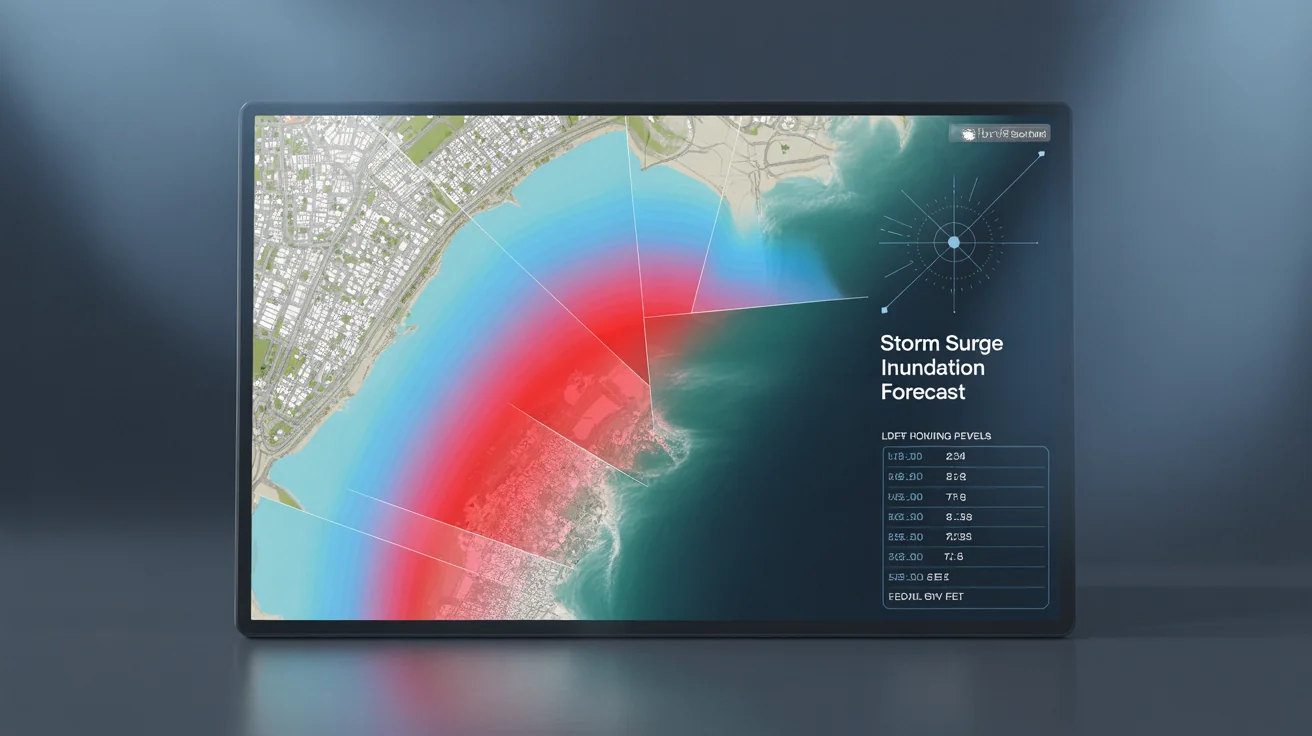
Start by typing a detailed description of the storm surge event you want to visualize. Include the location, storm intensity, and any specific colors or labels.
Click the generate button and the AI will interpret your prompt, creating a custom map that visualizes the potential coastal flooding based on your description.
Your high-resolution storm surge map is ready to be downloaded as a PNG file. Use it to enhance your presentations, reports, or educational content.
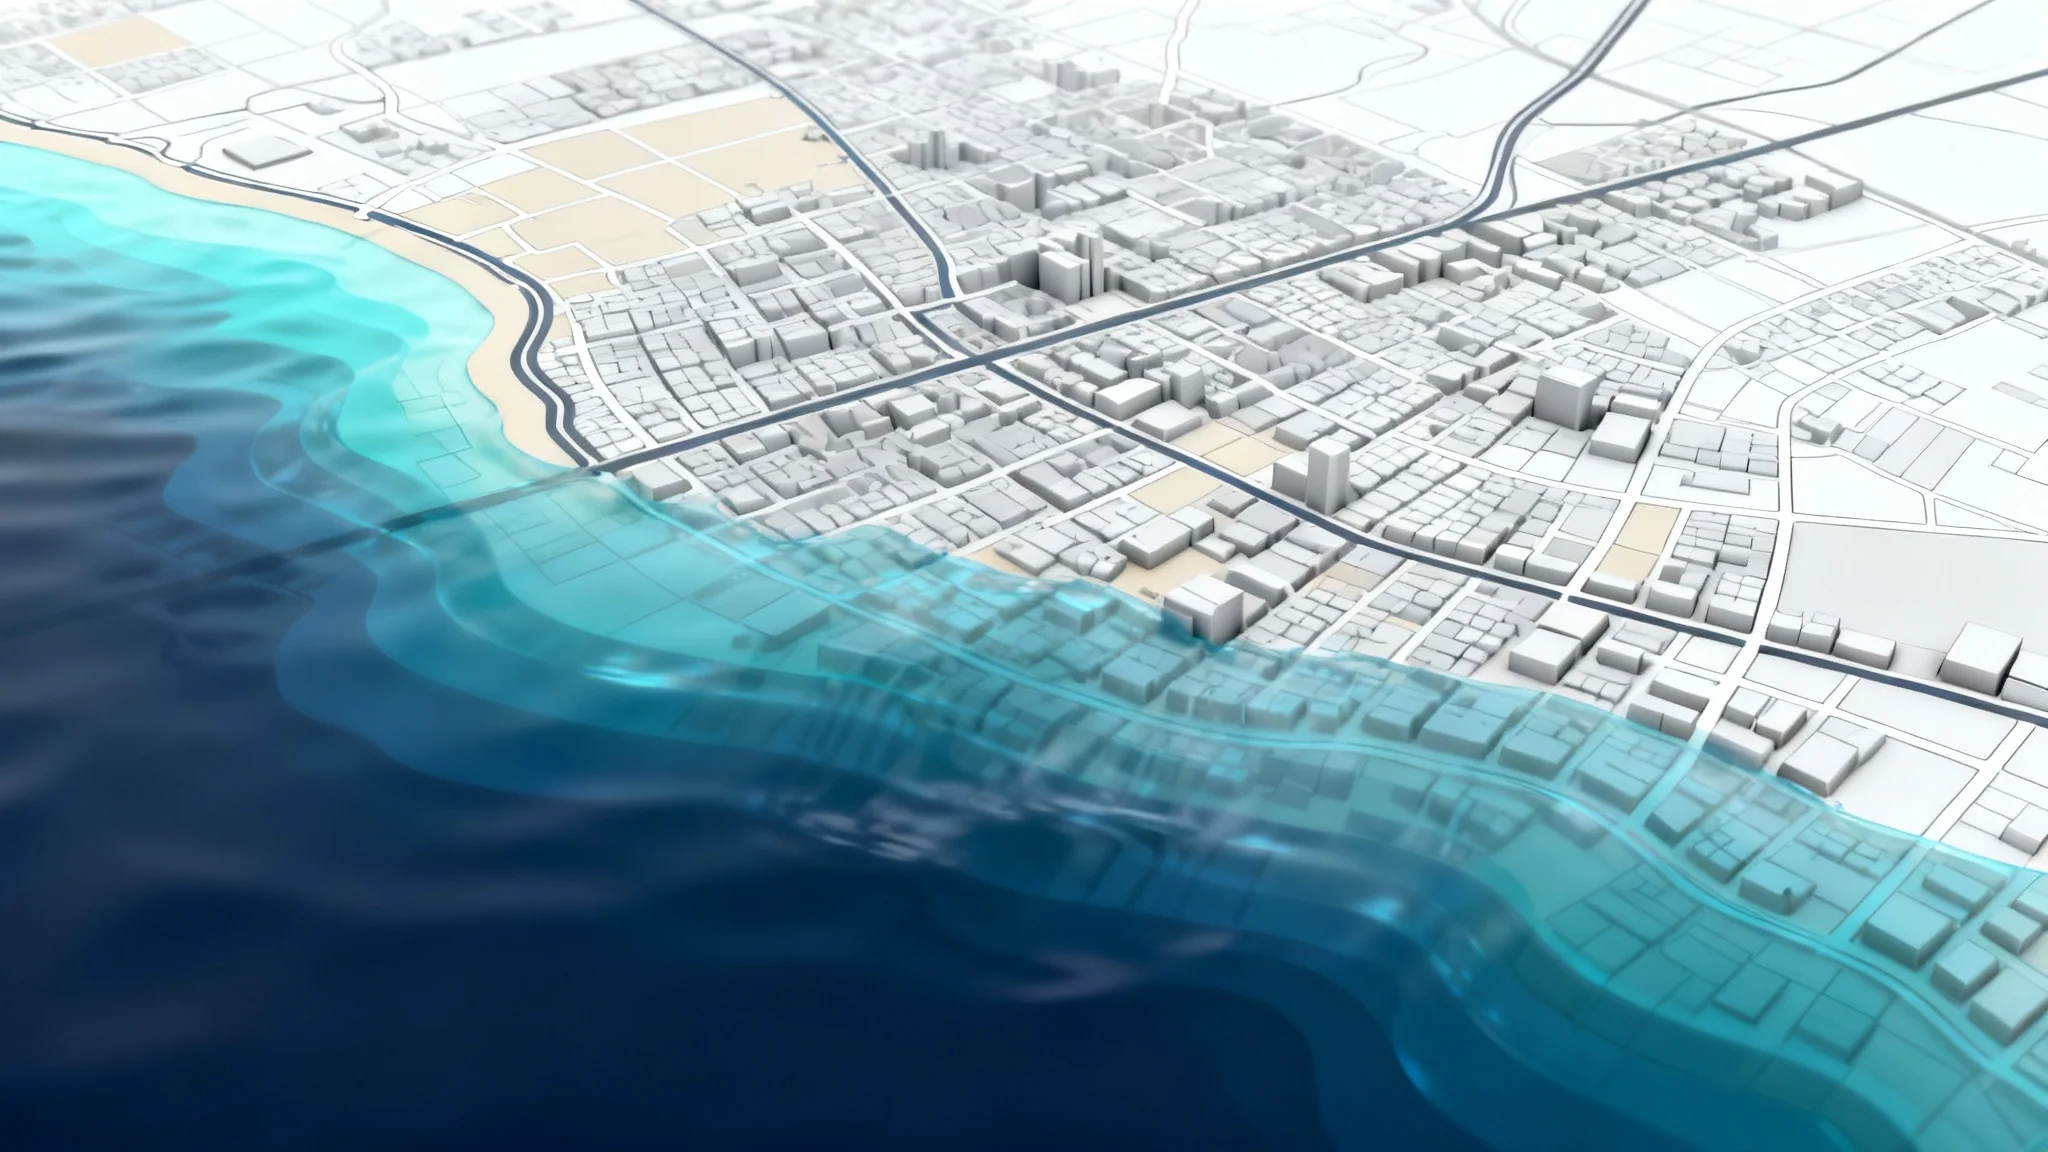
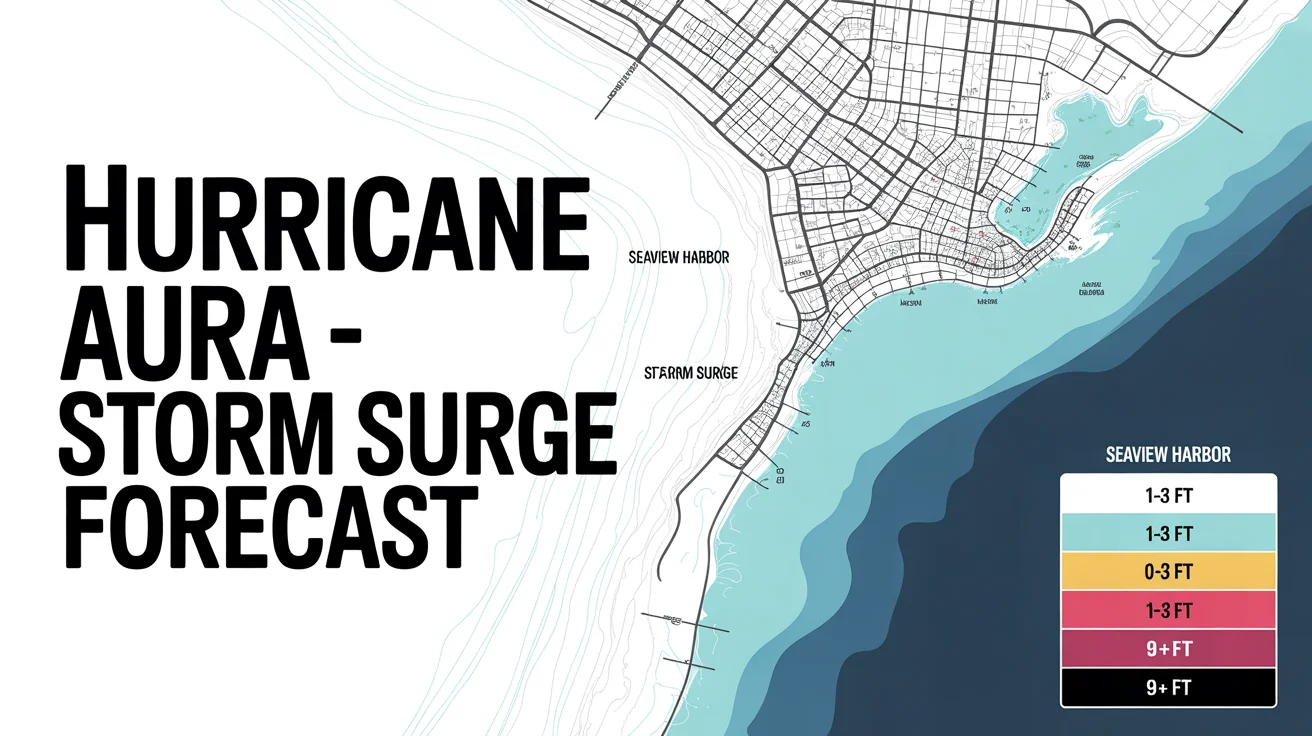
An AI storm surge map generator is a tool that uses artificial intelligence to create visual representations of potential coastal flooding from a text description. You can specify a location, a hurricane's strength, and other details to visualize how a storm surge might affect an area.
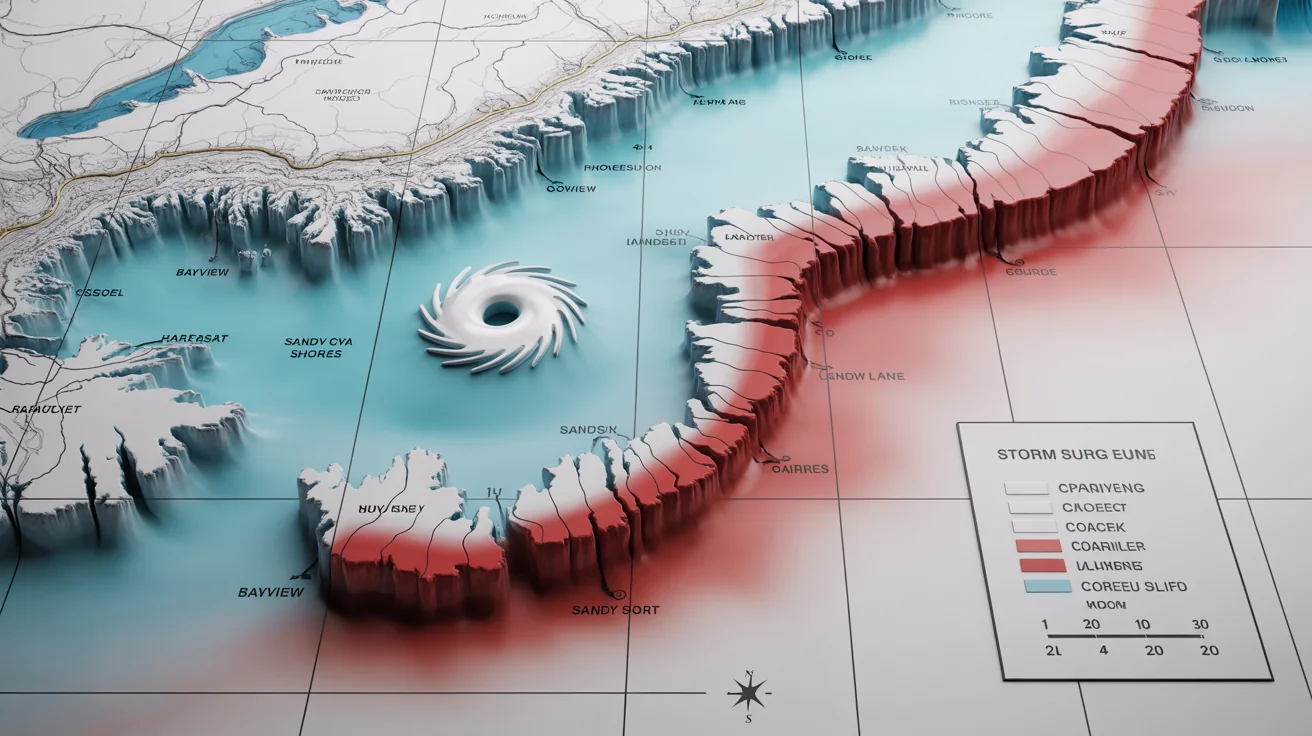
For the best results, describe the geographic location (e.g., 'the coast of Louisiana'), the type of storm (e.g., 'Category 3 hurricane'), and any specific visual elements you want to see, such as a 'color-coded key for water depth'.
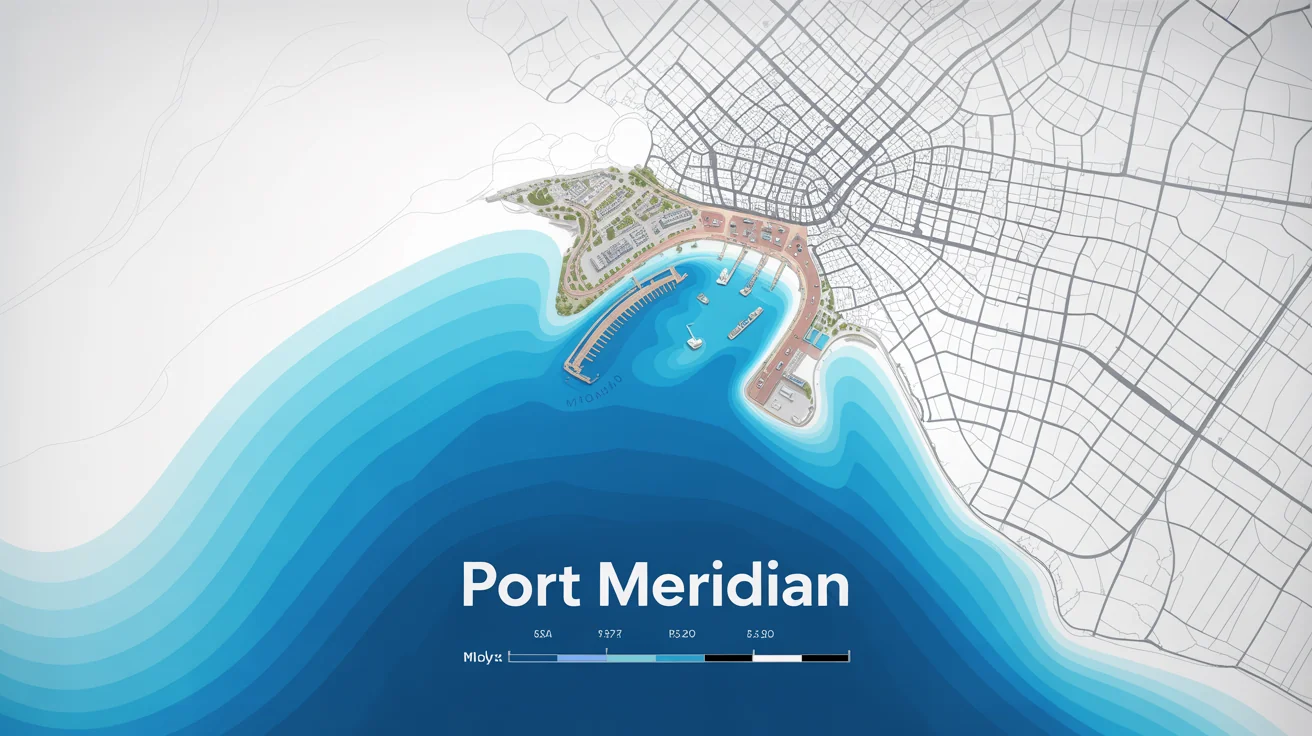
No, the maps generated are for visualization and informational purposes only. They are created based on your text prompt to illustrate hypothetical scenarios and are not connected to real-time weather forecasts or official warnings. For active storms, always consult official sources like the National Hurricane Center.
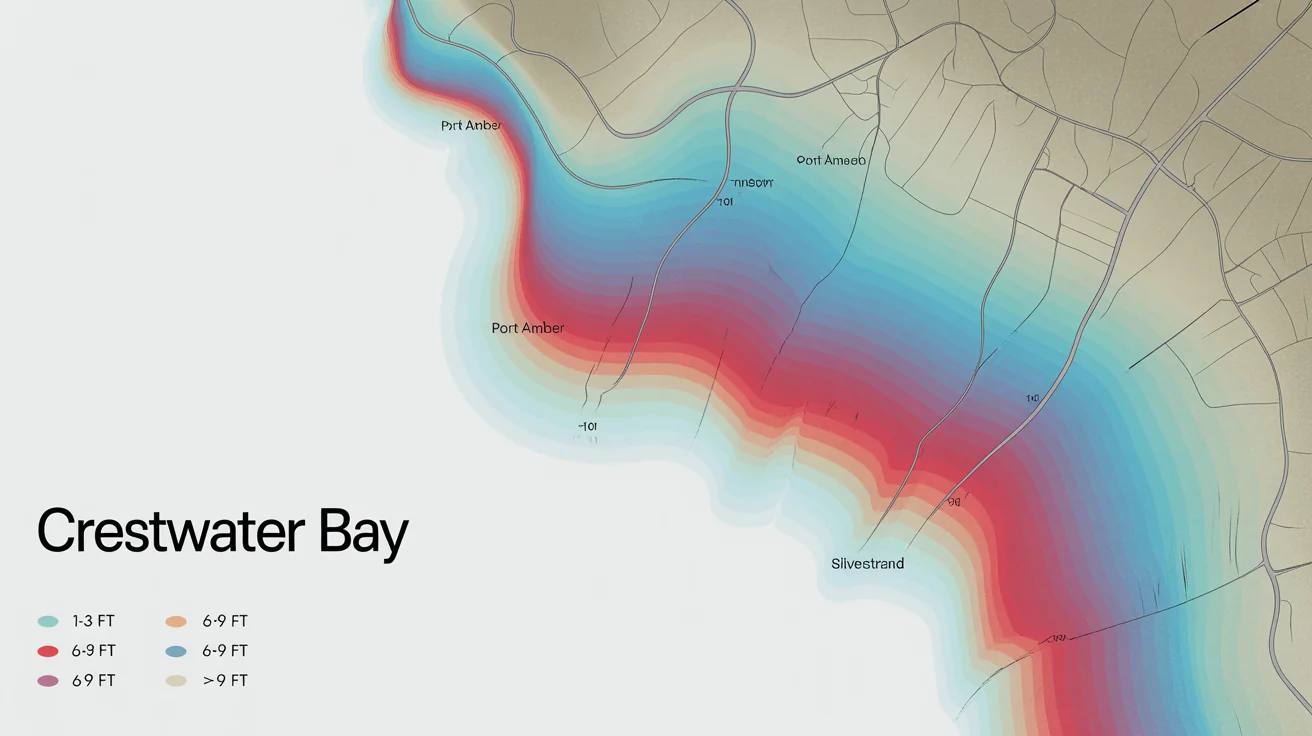
You can generate a storm surge map for any coastal location you can describe. The AI will create a visual representation based on the geographic features you mention in your prompt.
These maps are artistic visualizations based on your text prompt and should not be used for navigation, insurance, or official emergency planning. They are designed to help communicate the concept and potential scale of storm surge in a visually engaging way, not to replace scientific models like SLOSH or ADCIRC.
The maps are great for educational materials, presentations on climate resilience, journalistic content, or for personal projects to better understand storm surge risks in a visual format. They help make the abstract threat of storm surge more tangible.
Great app, easy to use. Helps our small business save time and money to create different marketing materials professionally. Thank you.
I need a good background remover for my work and I've been through them all it feels like. This one is the best by far. It's so easy to use and the results always look amazing. Thank you Pixelcut!
It's amazingly easy and gives the perfect results for my bags and accessories. It looks like it was done by a professional photographer.