Pixelcut
A professionally designed comparison chart showing three different models of modern wireless earbuds. The chart compares features like battery life, noise cancellation, and price in a clean, minimalist layout.

AI Earbud Comparison Chart Generator

7000万人に信頼されています
171,800件のレビュー
開発者API
iPhoneAndroid で利用可能

How to Create an Earbud Comparison Chart

  1. 1

    Describe your comparison chart

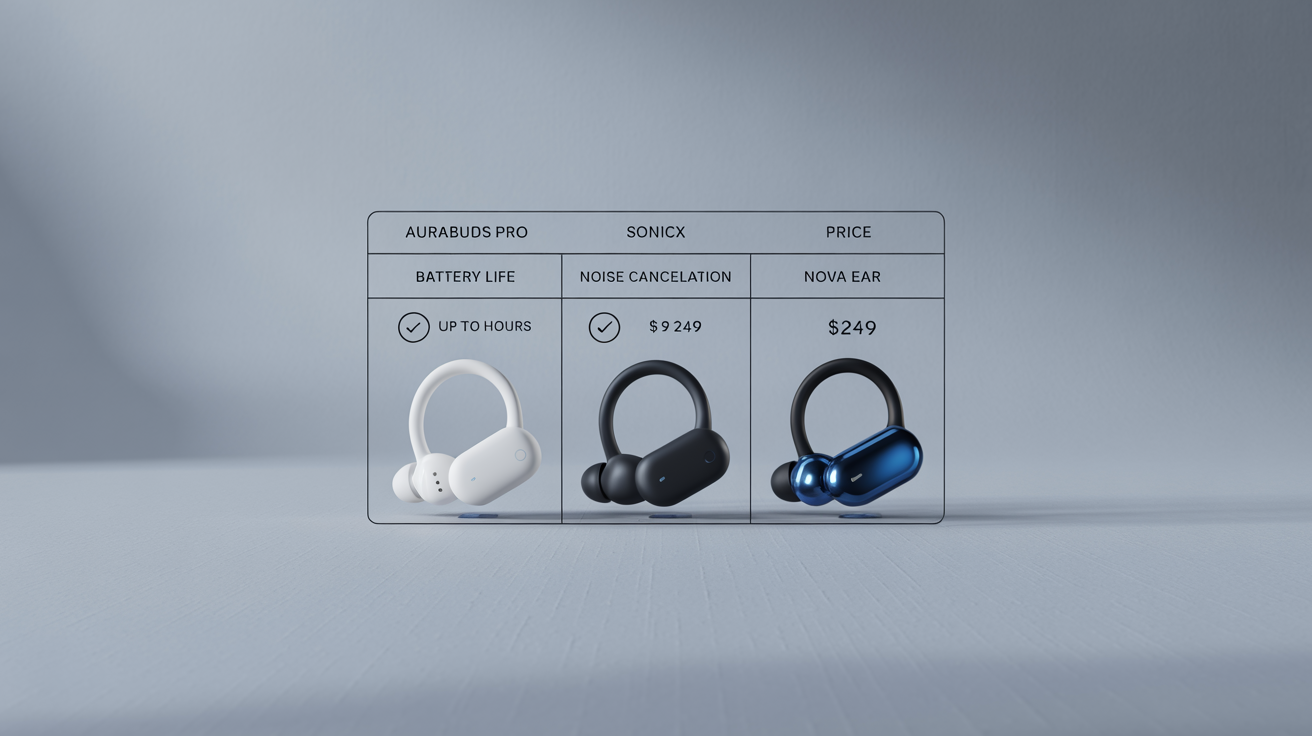
    Write a detailed prompt. Include the earbud models and the features to compare (e.g., 'Chart comparing Pixel Buds Pro and Galaxy Buds 3 Pro on ANC, battery, and call quality').

  2. 2

    Generate your chart

    With one click, the AI will interpret your prompt and create a custom infographic that visually represents the comparison you described.

  3. 3

    Download your graphic

    Your high-resolution comparison chart is ready to be downloaded as a PNG. Use it to help with your purchasing decision or share it in your content.

Move beyond plain text lists and generate compelling visual charts to compare earbuds. Our AI tool lets you transform your research into a clean, easy-to-read infographic. Simply describe the earbud models, the features you want to highlight, like battery life, noise cancellation, or price, and any design elements you envision. The AI will produce a graphic that makes your comparison clear and engaging, perfect for personal decision making, blog posts, or social media content, helping your audience grasp the differences at a glance.

Create Visual Comparisons Instantly

A lineup of four different pairs of wireless earbuds in black, white, rose gold, and blue, each with its case, arranged for comparison on a white background.
Tailor your earbud comparison chart to your exact needs. You have full control over the information presented. Specify which earbuds to feature, from popular models like Apple AirPods Pro and Sony WF-1000XM5 to niche brands. Dictate the key specifications to compare, such as driver size, codec support, or IP rating for durability. You can even guide the visual style, requesting a minimalistic design, a futuristic theme, or brand-specific colors to create a truly personalized and informative graphic that serves your specific purpose.

Fully Customizable Comparison Graphics

A flat lay photo showing three different pairs of wireless earbuds and their cases arranged neatly on a white background, suggesting a product comparison.
There is no need for complicated design software or chart-building tools. With a simple text prompt, you can generate a high-resolution comparison graphic in moments. This streamlined process saves you time and effort, whether you're a shopper trying to make a quick decision, a reviewer creating content, or a presenter preparing a slide. Just type your comparison details, and our AI handles the visual layout and design, delivering a professional-looking chart that is ready to download and share immediately.

From Prompt to Graphic in Seconds

A studio product shot showing a side-by-side comparison of three different models of wireless earbuds in black, white, and chrome, arranged neatly on a clean white background.
It’s Visual: Turn boring data into an engaging infographic that's easy to understand. It’s Fast: Go from a simple text description to a completed comparison chart in seconds. It’s Customizable: You decide which models, features, and styles to include in your graphic. Easy to Use: No design skills are required. If you can describe it, you can create it. Share Anywhere: Download your high-resolution PNG chart and use it on your blog, social media, or in presentations to help others make informed decisions.

Why use Pixelcut's AI Earbud Comparison Chart?

Four different pairs of modern wireless earbuds in black, white, silver, and blue, neatly arranged in a row for comparison on a clean white background.
Personal Buying Decisions: Create a side-by-side visual of your top choices to clarify which pair of earbuds best fits your needs. Content Creation: Generate eye-catching infographics for your tech blog, YouTube channel, or social media to compare the latest models for your audience. Presentations: Add a professional, data-driven visual to your slides when discussing market trends or competitor analysis in the audio tech space. Retail and E-commerce: Quickly produce graphics for product pages that help customers easily compare features between different earbud models.

Earbud Comparison Chart Use Cases

A lineup of four different pairs of modern wireless earbuds in various colors and styles, arranged for comparison on a clean white background.

よくある質問

Pixelcutは200万人以上に愛されています

  • 私のお気に入りのアプリ

    素晴らしいアプリ、使いやすい。中小企業がさまざまなマーケティング資料を専門的に作成するための時間と費用を節約できるようになります。ありがとう。
    シェイリン D.
  • 最高の背景除去剤

    私の仕事には優れた背景除去剤が必要で、私はそれをすべて経験してきました。これは今のところ最高です。使い方はとても簡単で、結果は常に素晴らしいものになります。ピクセルカットさん、ありがとうございます!
    キラ・H
  • 大好きです

    驚くほど簡単で、バッグやアクセサリーに完璧な結果が得られます。プロのカメラマンが撮影したようです。
    メアリー J.