Pixelcut
A professionally designed multi-panel scientific figure ready for publication. It includes a line graph showing cell viability, a scatter plot showing gene expression, and a 3D molecular model of a chemical compound, all clearly labeled on a white background.

Create Publication-Ready Scientific Figures with AI

7000万人に信頼されています
171,800件のレビュー
開発者API
iPhoneAndroid で利用可能

How to Edit Your Scientific Figure

  1. 1

    Upload your figure

    Begin by uploading the graph, chart, or scientific diagram you wish to edit. This can be a draft from another program or an existing figure that needs updates.

  2. 2

    Enter your prompt

    In the text box, describe the changes you want to make. Be specific with your instructions, such as 'Make the bars in the chart green' or 'Add an arrow pointing to the peak at 500 nm'.

  3. 3

    Generate your edited figure

    Our AI will process your request and apply the edits to your image, generating a new version of the figure based on your instructions.

  4. 4

    Download your figure

    Your updated, high-resolution scientific figure is now ready. Download the watermark-free PNG file for use in your research papers, presentations, or posters.
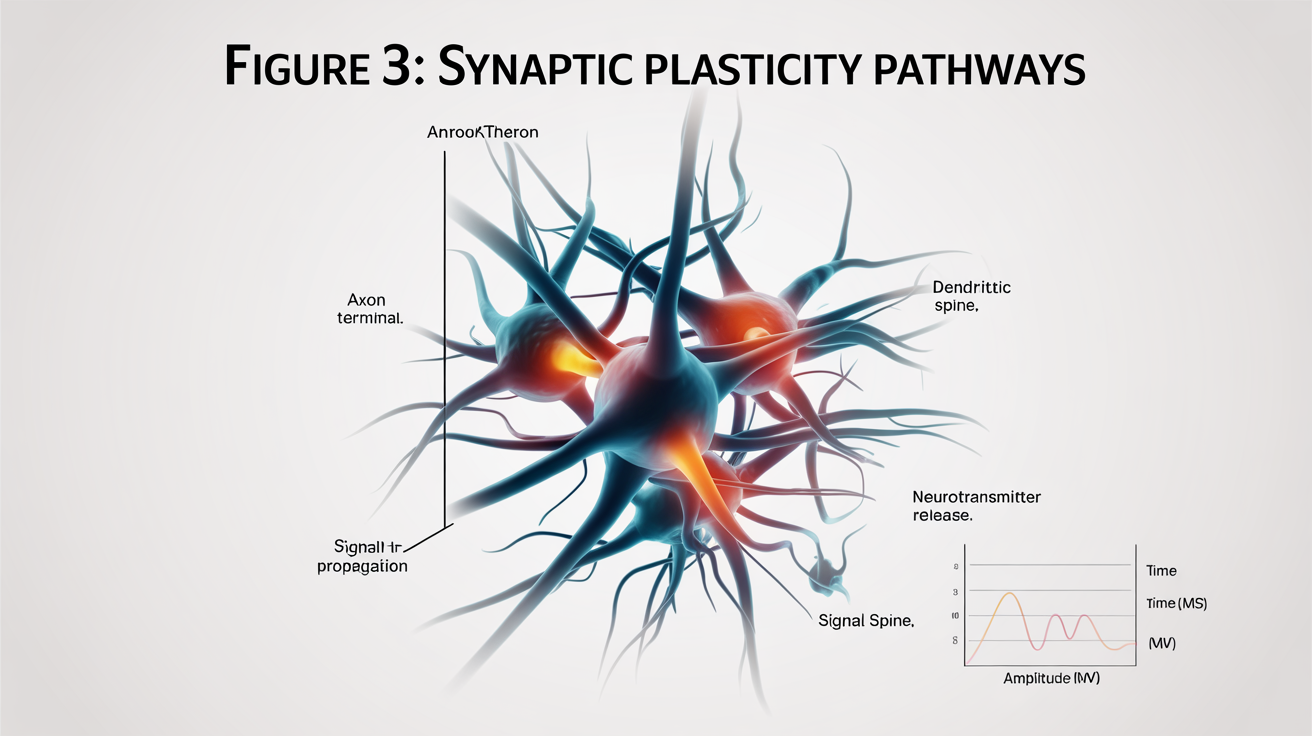
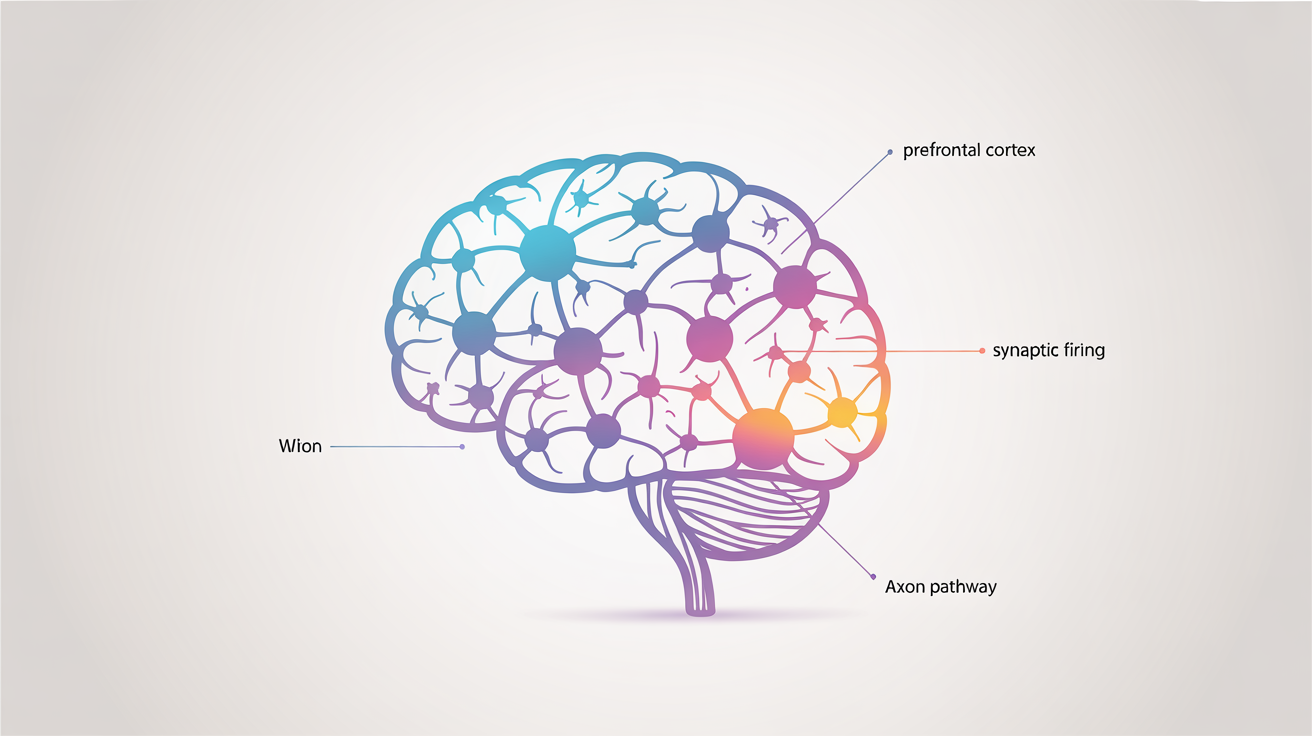
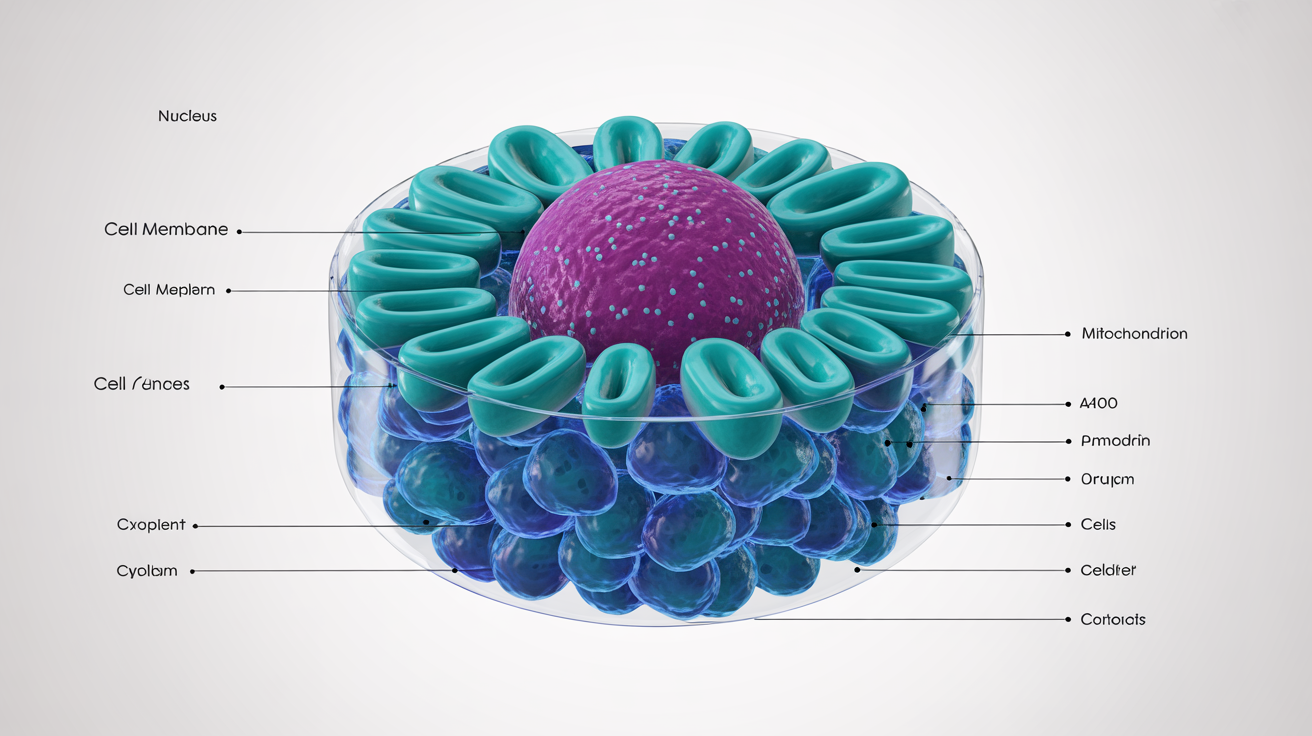
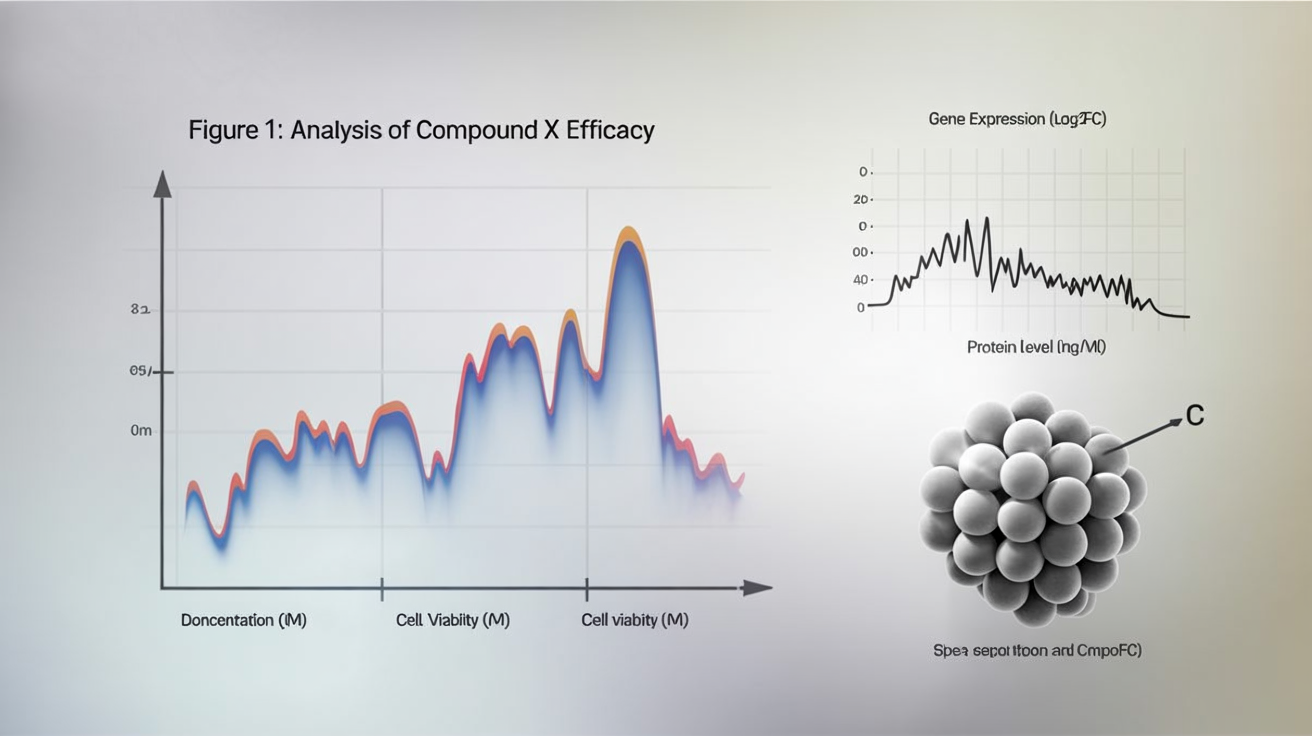
Transform your data into clear, compelling visuals without the steep learning curve of complex software. Pixelcut's AI scientific figure editor streamlines the entire process. Simply upload your existing chart or diagram and provide text-based instructions for the edits you need. Whether you're adjusting plot types, updating data points, or refining layouts, our tool interprets your commands to deliver precise results quickly. This intuitive approach allows you to focus on your research, not on mastering intricate design programs. Create professional figures in a fraction of the time.

Generate Clear Data Visualizations in Seconds

A 3D rendered scientific figure of a complex protein and DNA molecule against a white background, symbolizing scientific research and discovery.
Achieve full control over your scientific illustrations through conversational commands. Need to change the color scheme to be colorblind-friendly, or add specific annotations to highlight key findings?. Just describe your desired changes. You can modify axis labels, adjust legend placements, or alter graph styles by typing your instructions. For figures with text, include the exact titles or labels you want to see in your prompt for precise results. Our AI makes it easy to iterate on your designs until they perfectly represent your data for presentation or publication.

Refine Every Detail with Simple Text Prompts

A detailed scientific illustration of a plant cell's cross-section, showing organelles like the nucleus and chloroplasts on a white background.
Produce crisp, high-resolution figures suitable for any scientific context. Whether for journal submissions, conference posters, or academic presentations, your downloads are optimized for clarity and professional quality. The editor ensures that every element, from text to data points, is rendered sharply. This eliminates the need for post-generation touch-ups in other software, providing you with a finished, watermark-free PNG file that is ready for immediate use in your work, ensuring your data is presented effectively and professionally.

Publication-Quality Figures, Ready to Go

A professional scientific figure illustrating synaptic plasticity. It shows a diagram of neurons with glowing pathways, labeled with terms like 'Axon Terminal' and 'Signal Propagation'. The figure is titled 'Synaptic Plasticity Pathways' and includes a small graph.
It's Fast: Go from a rough draft to a polished figure in just a few moments. It's Intuitive: Edit complex graphs using simple, conversational text. No coding or complex menus. AI-Powered: Let AI handle the intricate design adjustments, allowing you to focus on the scientific narrative. High-Quality Output: Download high-resolution, watermark-free PNGs ready for journals, presentations, and posters. Versatile: Perfect for a wide range of data visualizations, including bar charts, line graphs, scatter plots, and more.

Why use Pixelcut's AI Scientific Figure Editor?

A detailed scientific illustration of a human neural network, showing glowing neurons and pathways with labels like 'Synaptic Firing'. The figure is presented in a clean, modern infographic style on a white background.
Journal Articles: Prepare clear and accurate figures that meet the stringent requirements for peer-reviewed publications. Conference Posters: Design eye-catching graphs and diagrams that effectively communicate your research findings to a broad audience. Academic Presentations: Create visually engaging slides that help your audience understand complex data and concepts with ease. Grant Proposals: Illustrate your research plans with compelling visuals that help funding committees quickly grasp your project's goals and potential impact. Thesis and Dissertations: Elevate your academic work with professional-quality figures that clearly present your research data.

Scientific Figure Editor Use Cases

A detailed and colorful scientific illustration of an animal cell cross-section. The diagram, set against a white background, uses shades of teal and magenta and includes clear, legible labels for organelles like the 'Nucleus' and 'Mitochondrion'.

よくある質問

Pixelcutは200万人以上に愛されています

  • 私のお気に入りのアプリ

    素晴らしいアプリ、使いやすい。中小企業がさまざまなマーケティング資料を専門的に作成するための時間と費用を節約できるようになります。ありがとう。
    シェイリン D.
  • 最高の背景除去剤

    私の仕事には優れた背景除去剤が必要で、私はそれをすべて経験してきました。これは今のところ最高です。使い方はとても簡単で、結果は常に素晴らしいものになります。ピクセルカットさん、ありがとうございます!
    キラ・H
  • 大好きです

    驚くほど簡単で、バッグやアクセサリーに完璧な結果が得られます。プロのカメラマンが撮影したようです。
    メアリー J.