私のお気に入りのアプリ
素晴らしいアプリ、使いやすい。中小企業がさまざまなマーケティング資料を専門的に作成するための時間と費用を節約できるようになります。ありがとう。
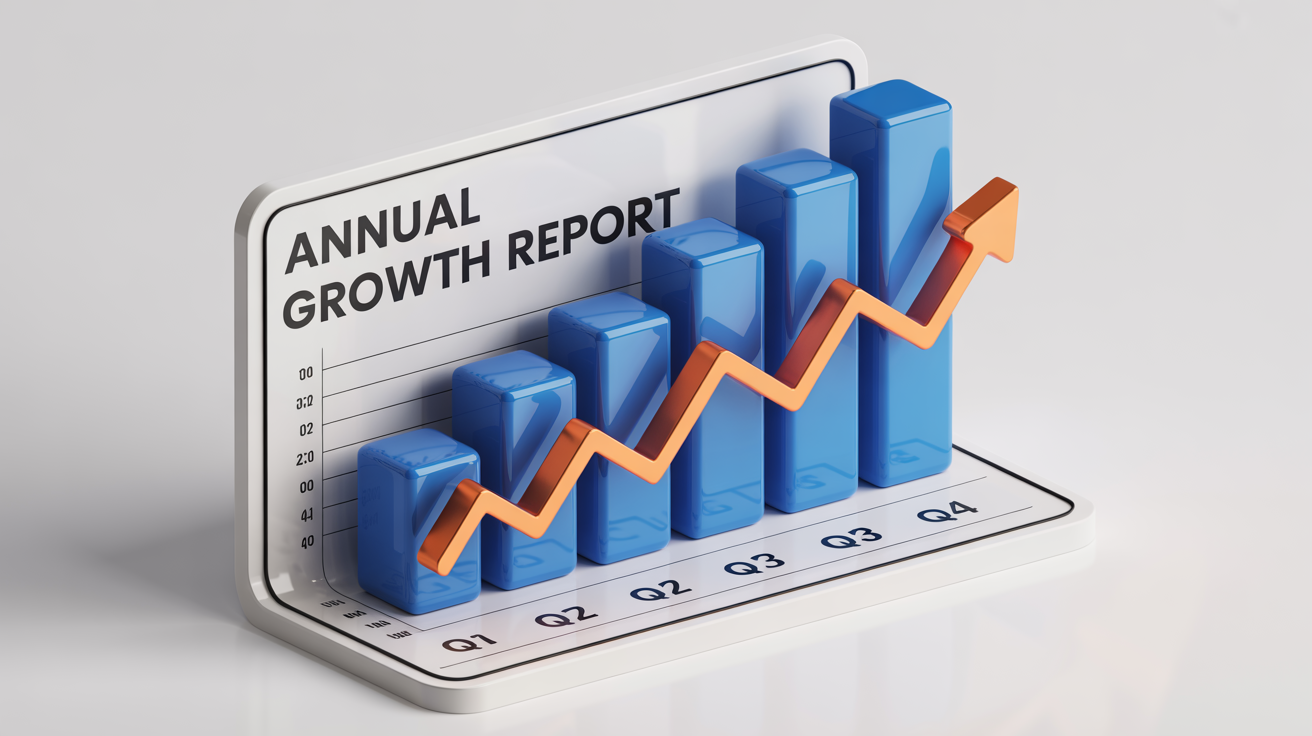
Write a prompt detailing the chart you need. Include the chart type, data, labels, colors, and style. For example, 'A vibrant 3D pie chart showing market share.'
Click the generate button and let the AI interpret your prompt. It will create a unique visual representation of your data based on your description.
Your custom chart is ready to download as a high-resolution PNG file. Add it to your PowerPoint slides to make your presentation more engaging and professional.
An AI PowerPoint chart designer is a tool that uses artificial intelligence to generate chart images from text descriptions. You can specify the chart type, data points, colors, and overall style, and the AI will create a custom visual that you can download and add to your presentation slides.
Simply type a detailed prompt describing the chart you want to create. Include details like the type of chart (e.g., 'bar chart', 'line graph'), the data you want to represent, and any stylistic preferences like colors or a 3D effect. The AI will then generate a high-resolution PNG image of your chart for you to download.
Yes, you should include the data points and labels directly in your text prompt. For example, you could write, 'A bar chart showing social media engagement: Facebook at 500 likes, Instagram at 800 likes, and Twitter at 350 likes.' The more detailed your description, the more accurate your chart will be.
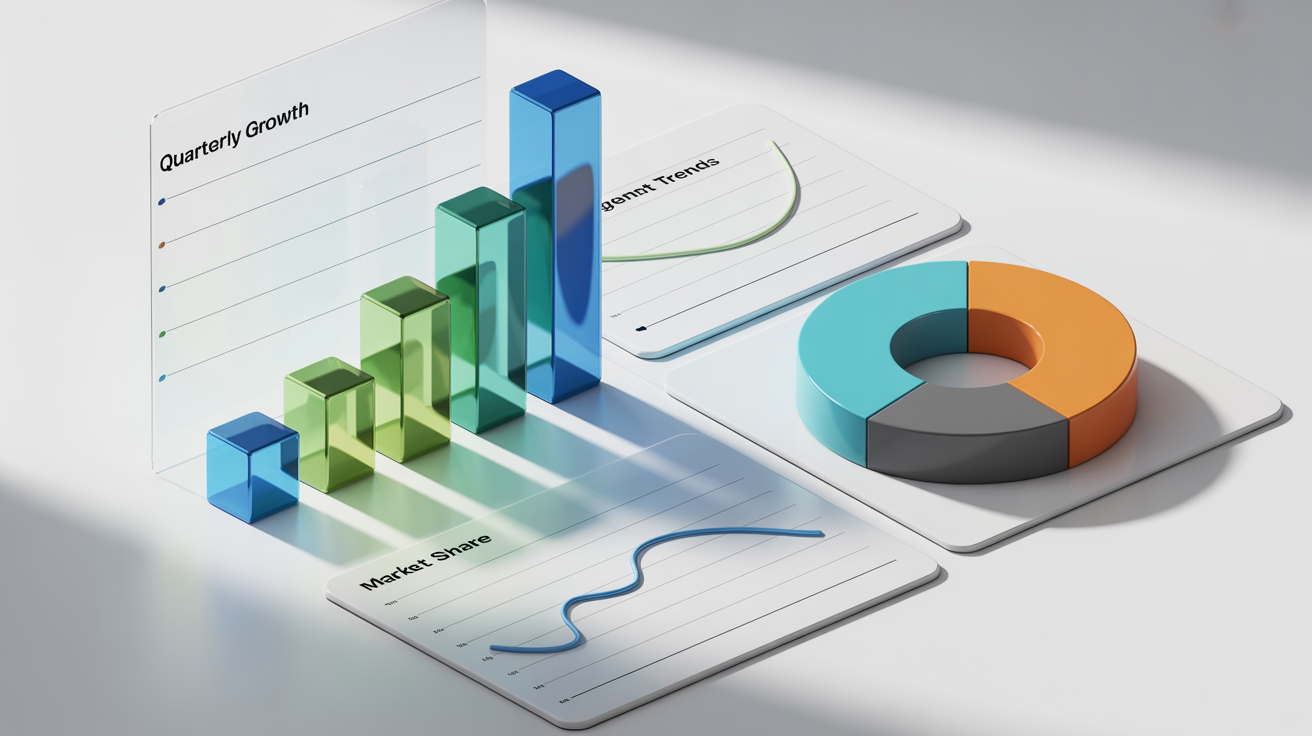
You can create a wide variety of common chart types, including bar charts, pie charts, line graphs, and donut charts. You can also request different visual styles for these charts, such as 2D, 3D, minimalist, or infographic-style designs, by including these details in your prompt.
Absolutely. The AI generates a high-resolution, watermark-free PNG image of your chart. You can download this file and insert it directly into your PowerPoint, Google Slides, or any other presentation software just like you would with any other image.
Not at all. The main benefit of using an AI chart designer is that it handles all the design work for you. You only need to provide a clear description of what you want the chart to look like and what data it should display. The AI takes care of the layout, spacing, and visual appeal.
素晴らしいアプリ、使いやすい。中小企業がさまざまなマーケティング資料を専門的に作成するための時間と費用を節約できるようになります。ありがとう。
私の仕事には優れた背景除去剤が必要で、私はそれをすべて経験してきました。これは今のところ最高です。使い方はとても簡単で、結果は常に素晴らしいものになります。ピクセルカットさん、ありがとうございます!
驚くほど簡単で、バッグやアクセサリーに完璧な結果が得られます。プロのカメラマンが撮影したようです。