私のお気に入りのアプリ
素晴らしいアプリ、使いやすい。中小企業がさまざまなマーケティング資料を専門的に作成するための時間と費用を節約できるようになります。ありがとう。
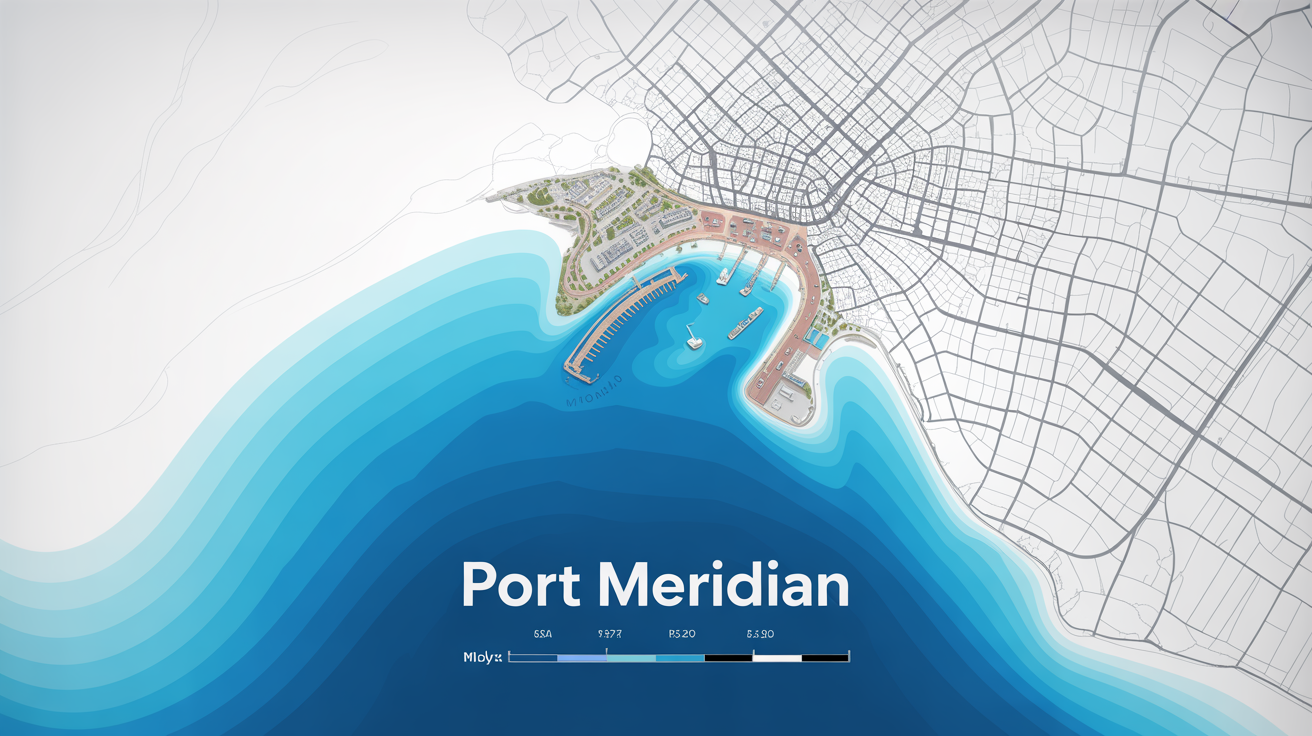
Start by typing a detailed description of the storm surge event you want to visualize. Include the location, storm intensity, and any specific colors or labels.
Click the generate button and the AI will interpret your prompt, creating a custom map that visualizes the potential coastal flooding based on your description.
Your high-resolution storm surge map is ready to be downloaded as a PNG file. Use it to enhance your presentations, reports, or educational content.
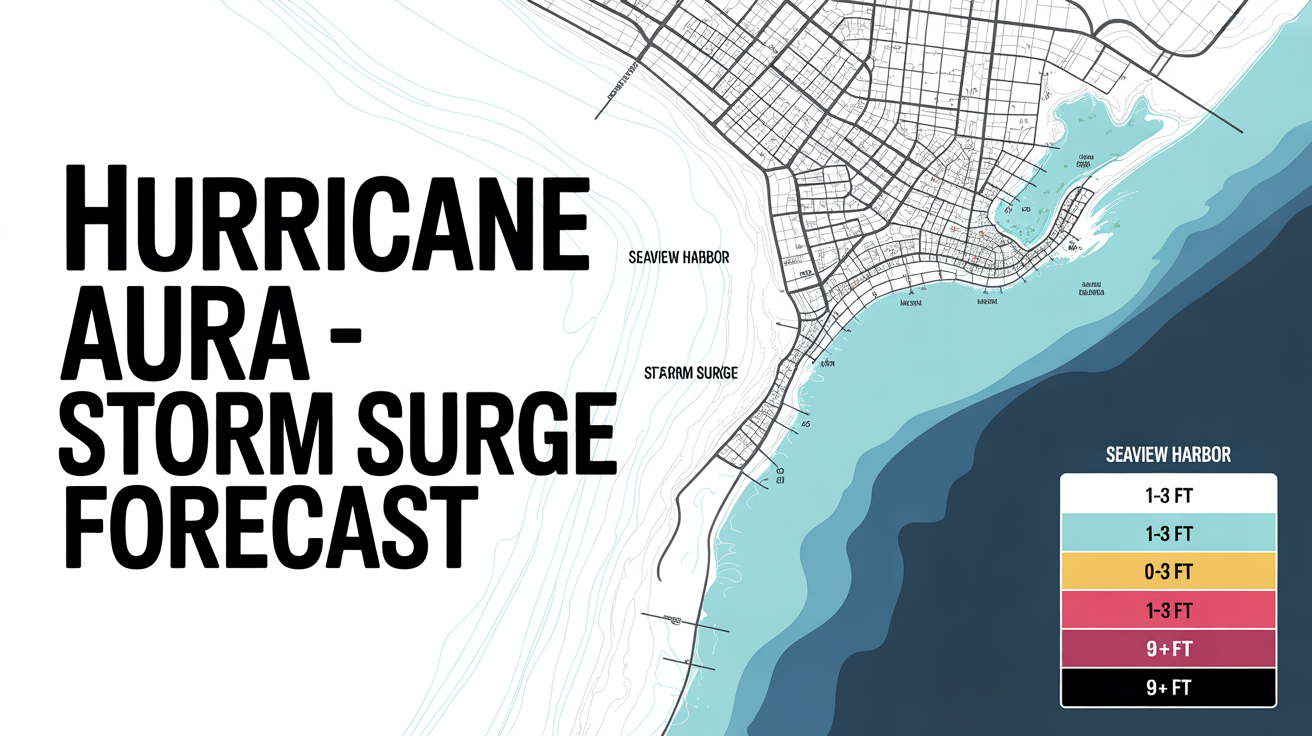
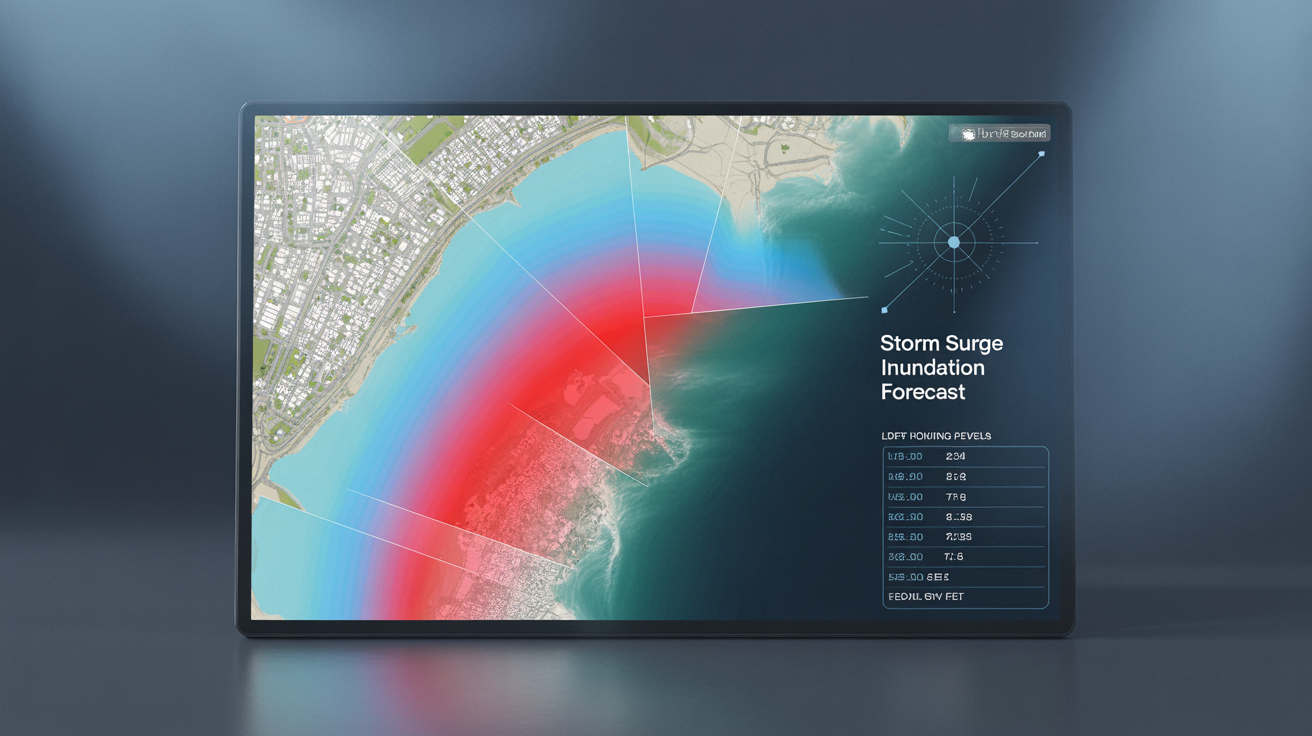
An AI storm surge map generator is a tool that uses artificial intelligence to create visual representations of potential coastal flooding from a text description. You can specify a location, a hurricane's strength, and other details to visualize how a storm surge might affect an area.
For the best results, describe the geographic location (e.g., 'the coast of Louisiana'), the type of storm (e.g., 'Category 3 hurricane'), and any specific visual elements you want to see, such as a 'color-coded key for water depth'.
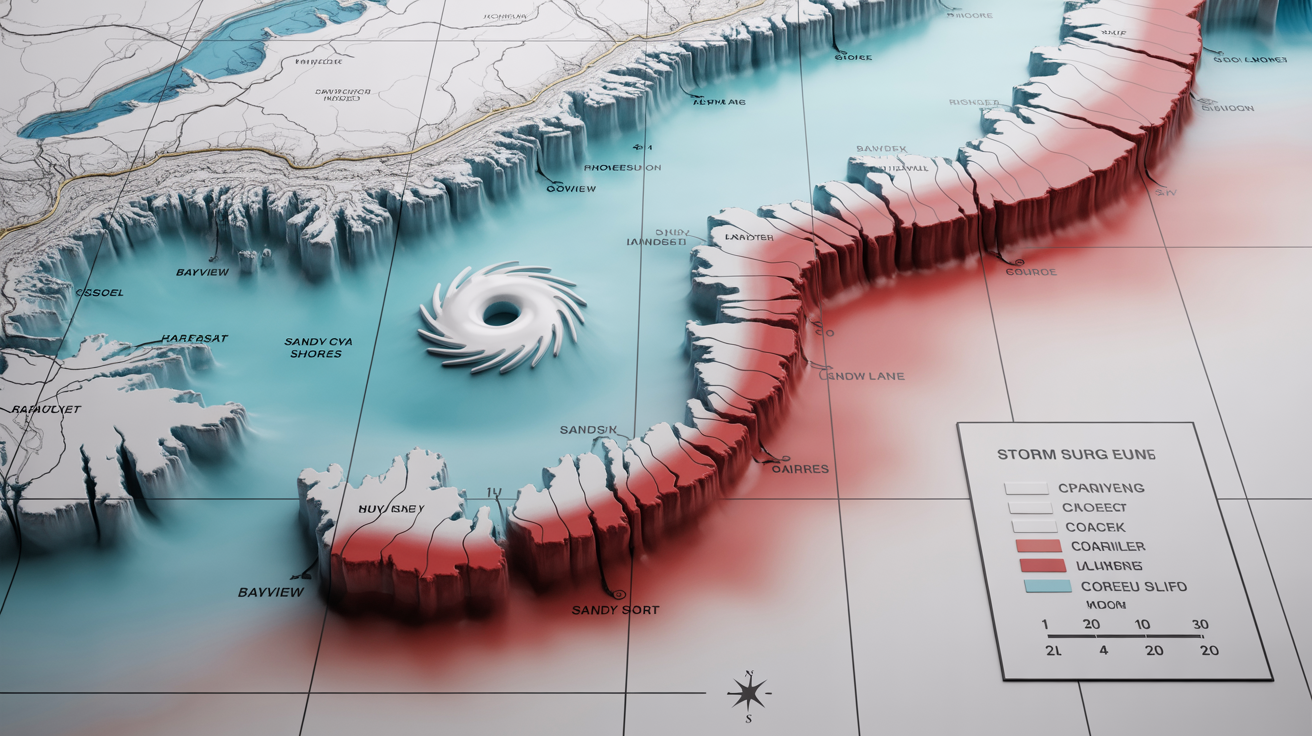
No, the maps generated are for visualization and informational purposes only. They are created based on your text prompt to illustrate hypothetical scenarios and are not connected to real-time weather forecasts or official warnings. For active storms, always consult official sources like the National Hurricane Center.
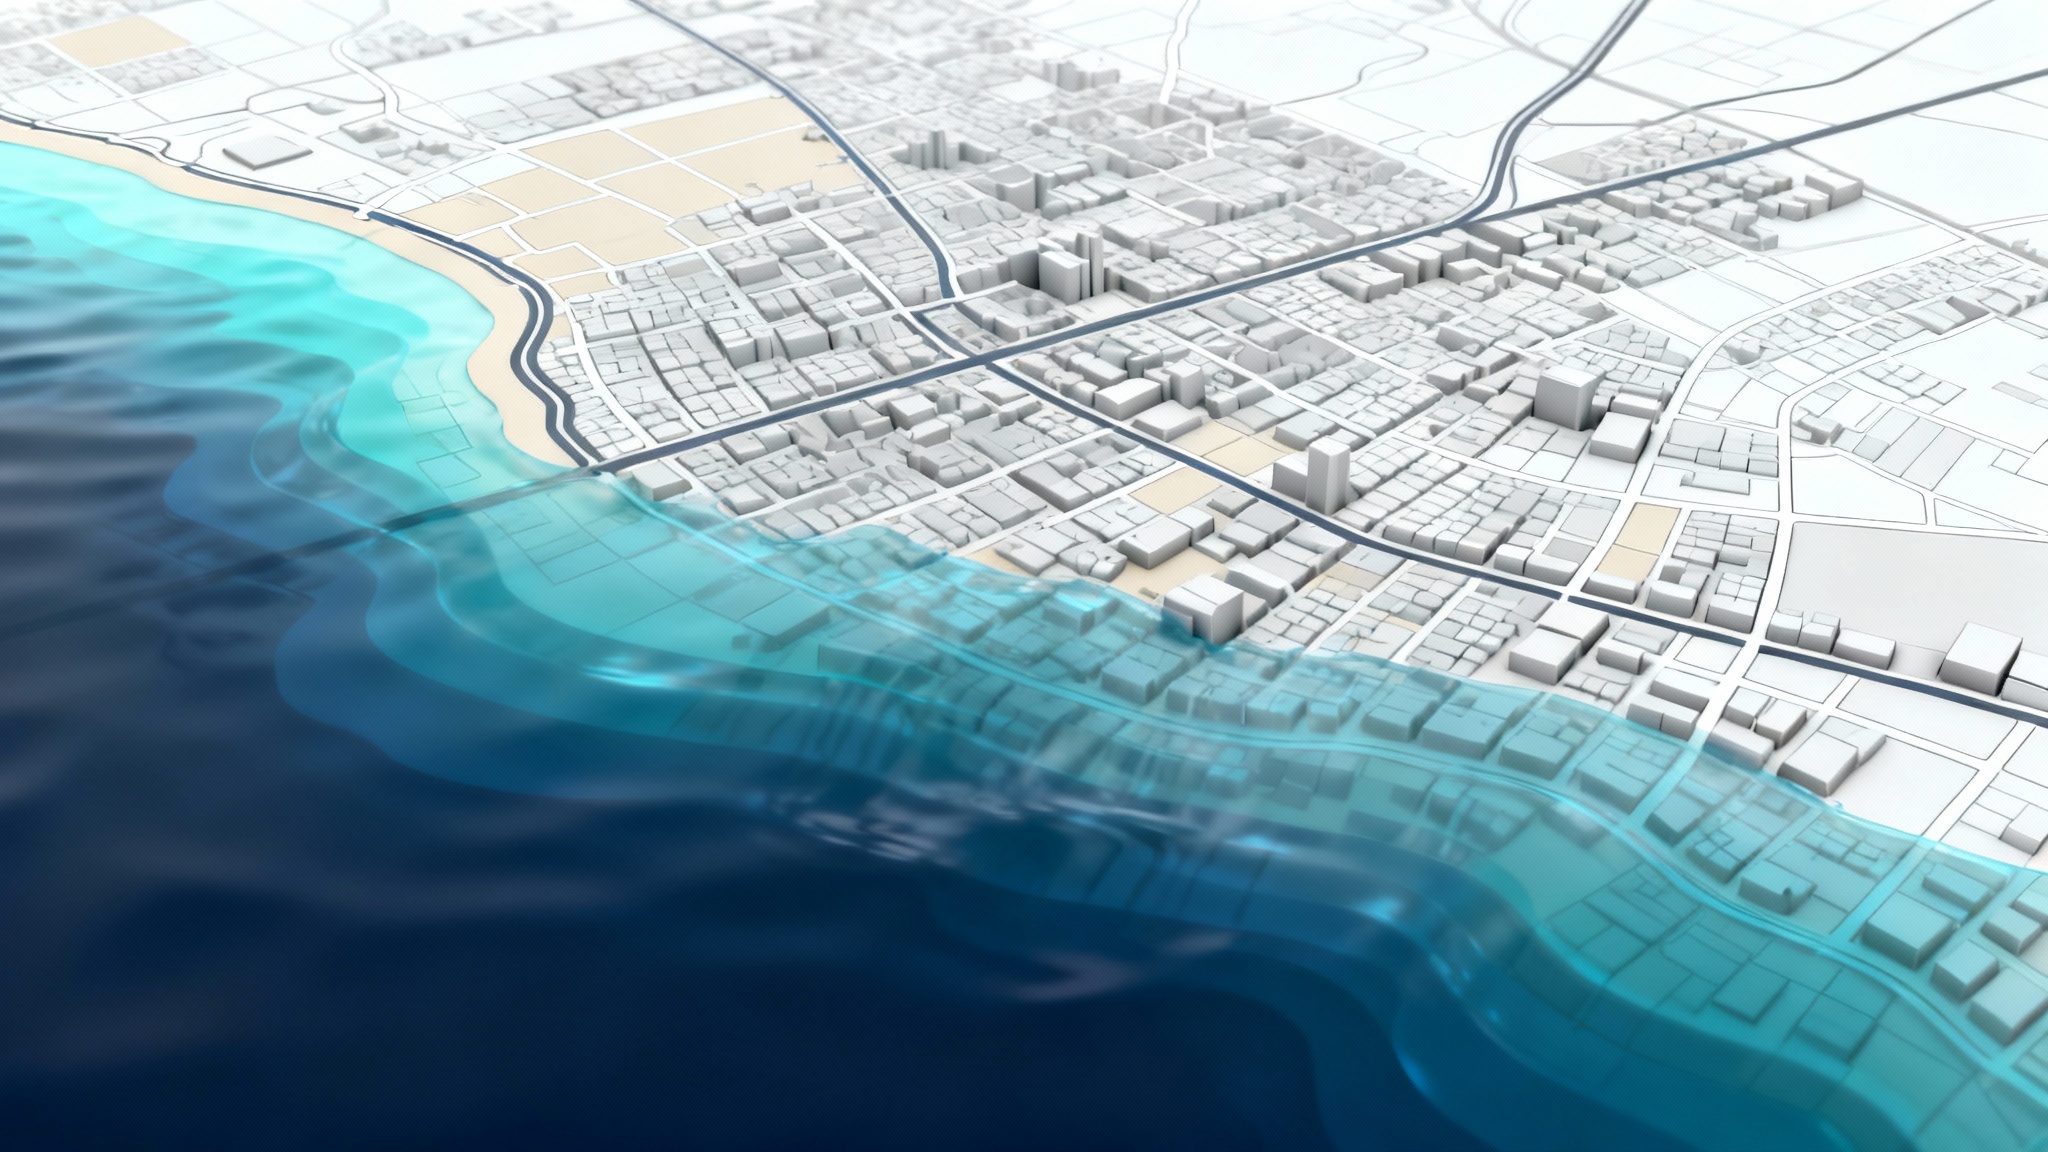
You can generate a storm surge map for any coastal location you can describe. The AI will create a visual representation based on the geographic features you mention in your prompt.
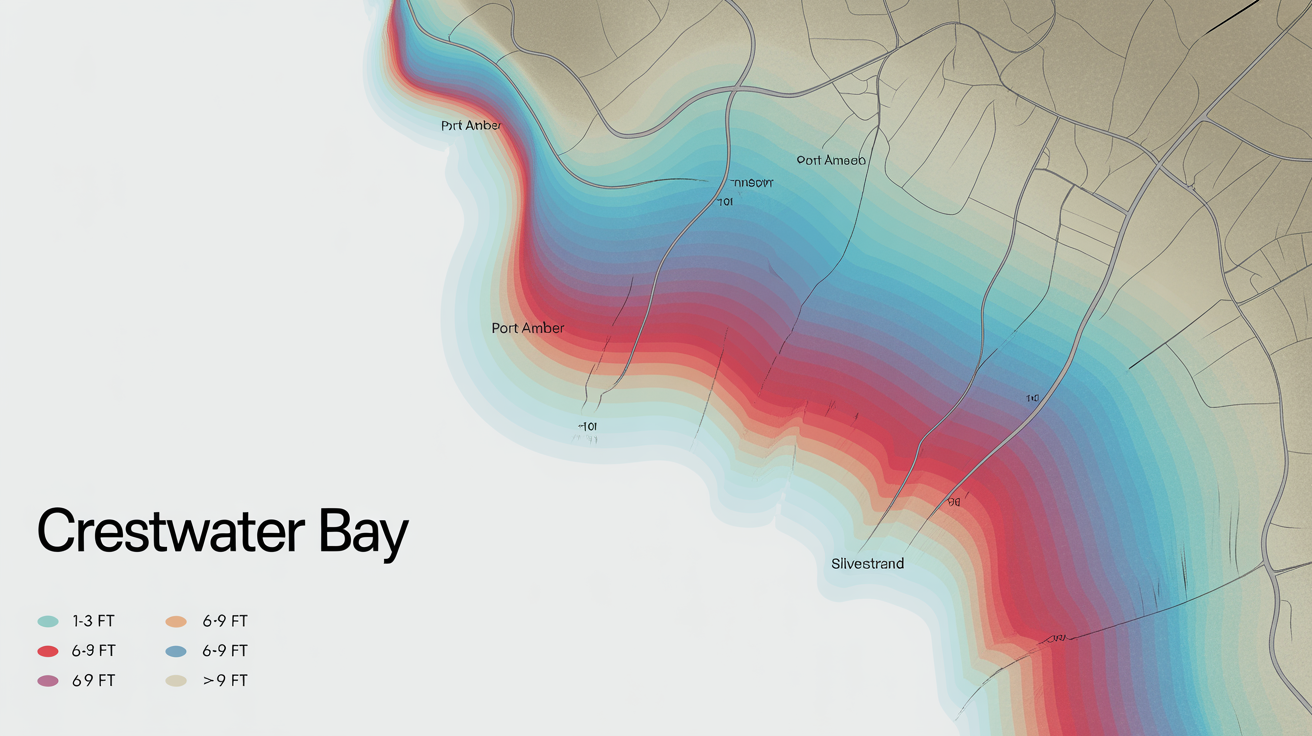
These maps are artistic visualizations based on your text prompt and should not be used for navigation, insurance, or official emergency planning. They are designed to help communicate the concept and potential scale of storm surge in a visually engaging way, not to replace scientific models like SLOSH or ADCIRC.
The maps are great for educational materials, presentations on climate resilience, journalistic content, or for personal projects to better understand storm surge risks in a visual format. They help make the abstract threat of storm surge more tangible.
素晴らしいアプリ、使いやすい。中小企業がさまざまなマーケティング資料を専門的に作成するための時間と費用を節約できるようになります。ありがとう。
私の仕事には優れた背景除去剤が必要で、私はそれをすべて経験してきました。これは今のところ最高です。使い方はとても簡単で、結果は常に素晴らしいものになります。ピクセルカットさん、ありがとうございます!
驚くほど簡単で、バッグやアクセサリーに完璧な結果が得られます。プロのカメラマンが撮影したようです。