Pixelcut
A side-by-side comparison of a flooded town. The left side is a photo of the flood. The right side is a data map of the same area with the flood extent precisely highlighted in a blue overlay, showing the output of a flood mapping tool.

AI Flood Extent Mapping

7000万人に信頼されています
171,800件のレビュー
開発者API
iPhoneAndroid で利用可能

How to create a flood map

  1. 1

    Upload Your Aerial Image

    Start by uploading a satellite, drone, or other aerial image of the area you want to analyze. High-resolution images work best.

  2. 2

    Describe Your Request

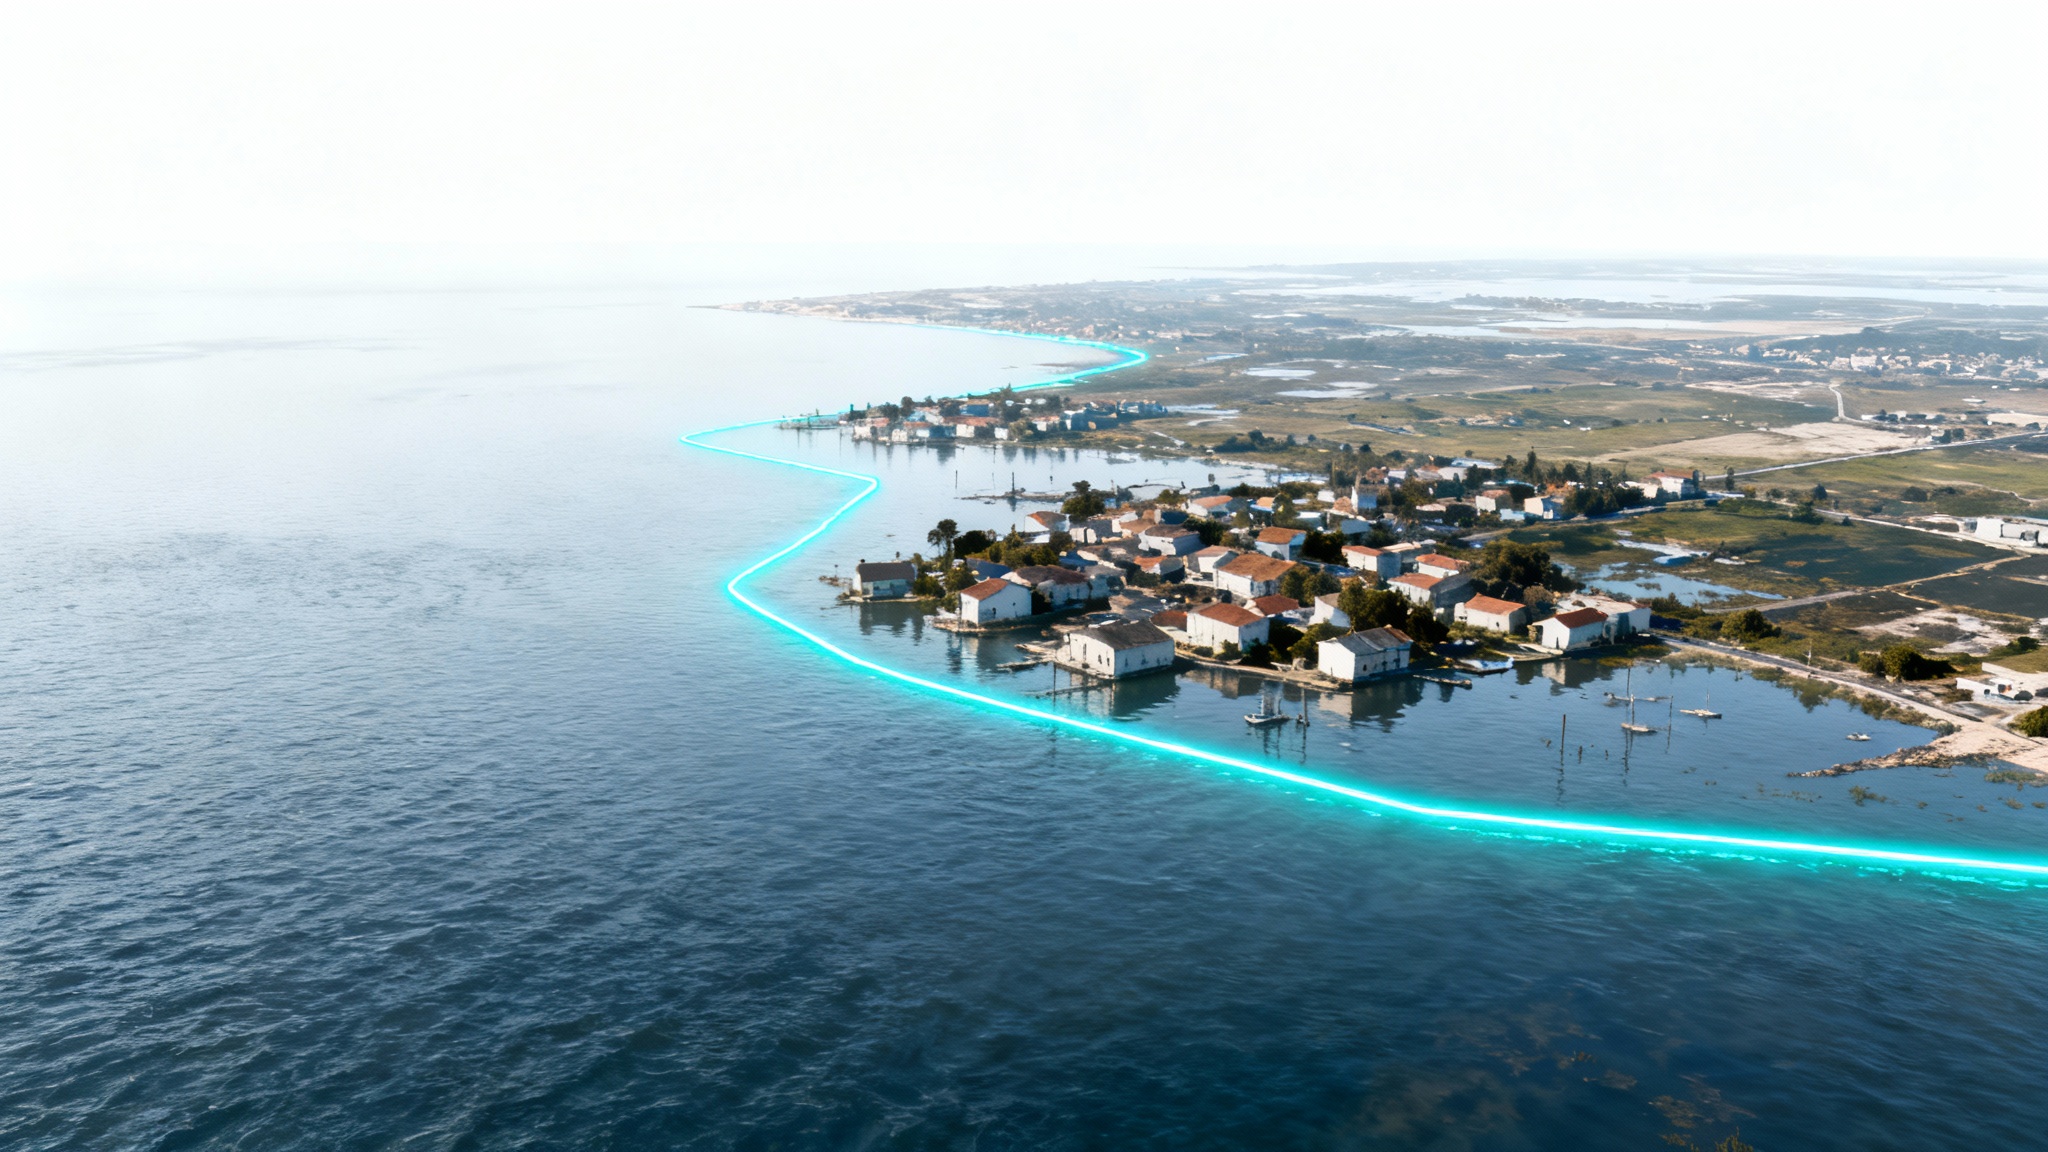
    In the text prompt, tell the AI what you want it to do. For example, type 'Map the flooded areas' or 'Outline the water in this image'.

  3. 3

    Generate Your Flood Map

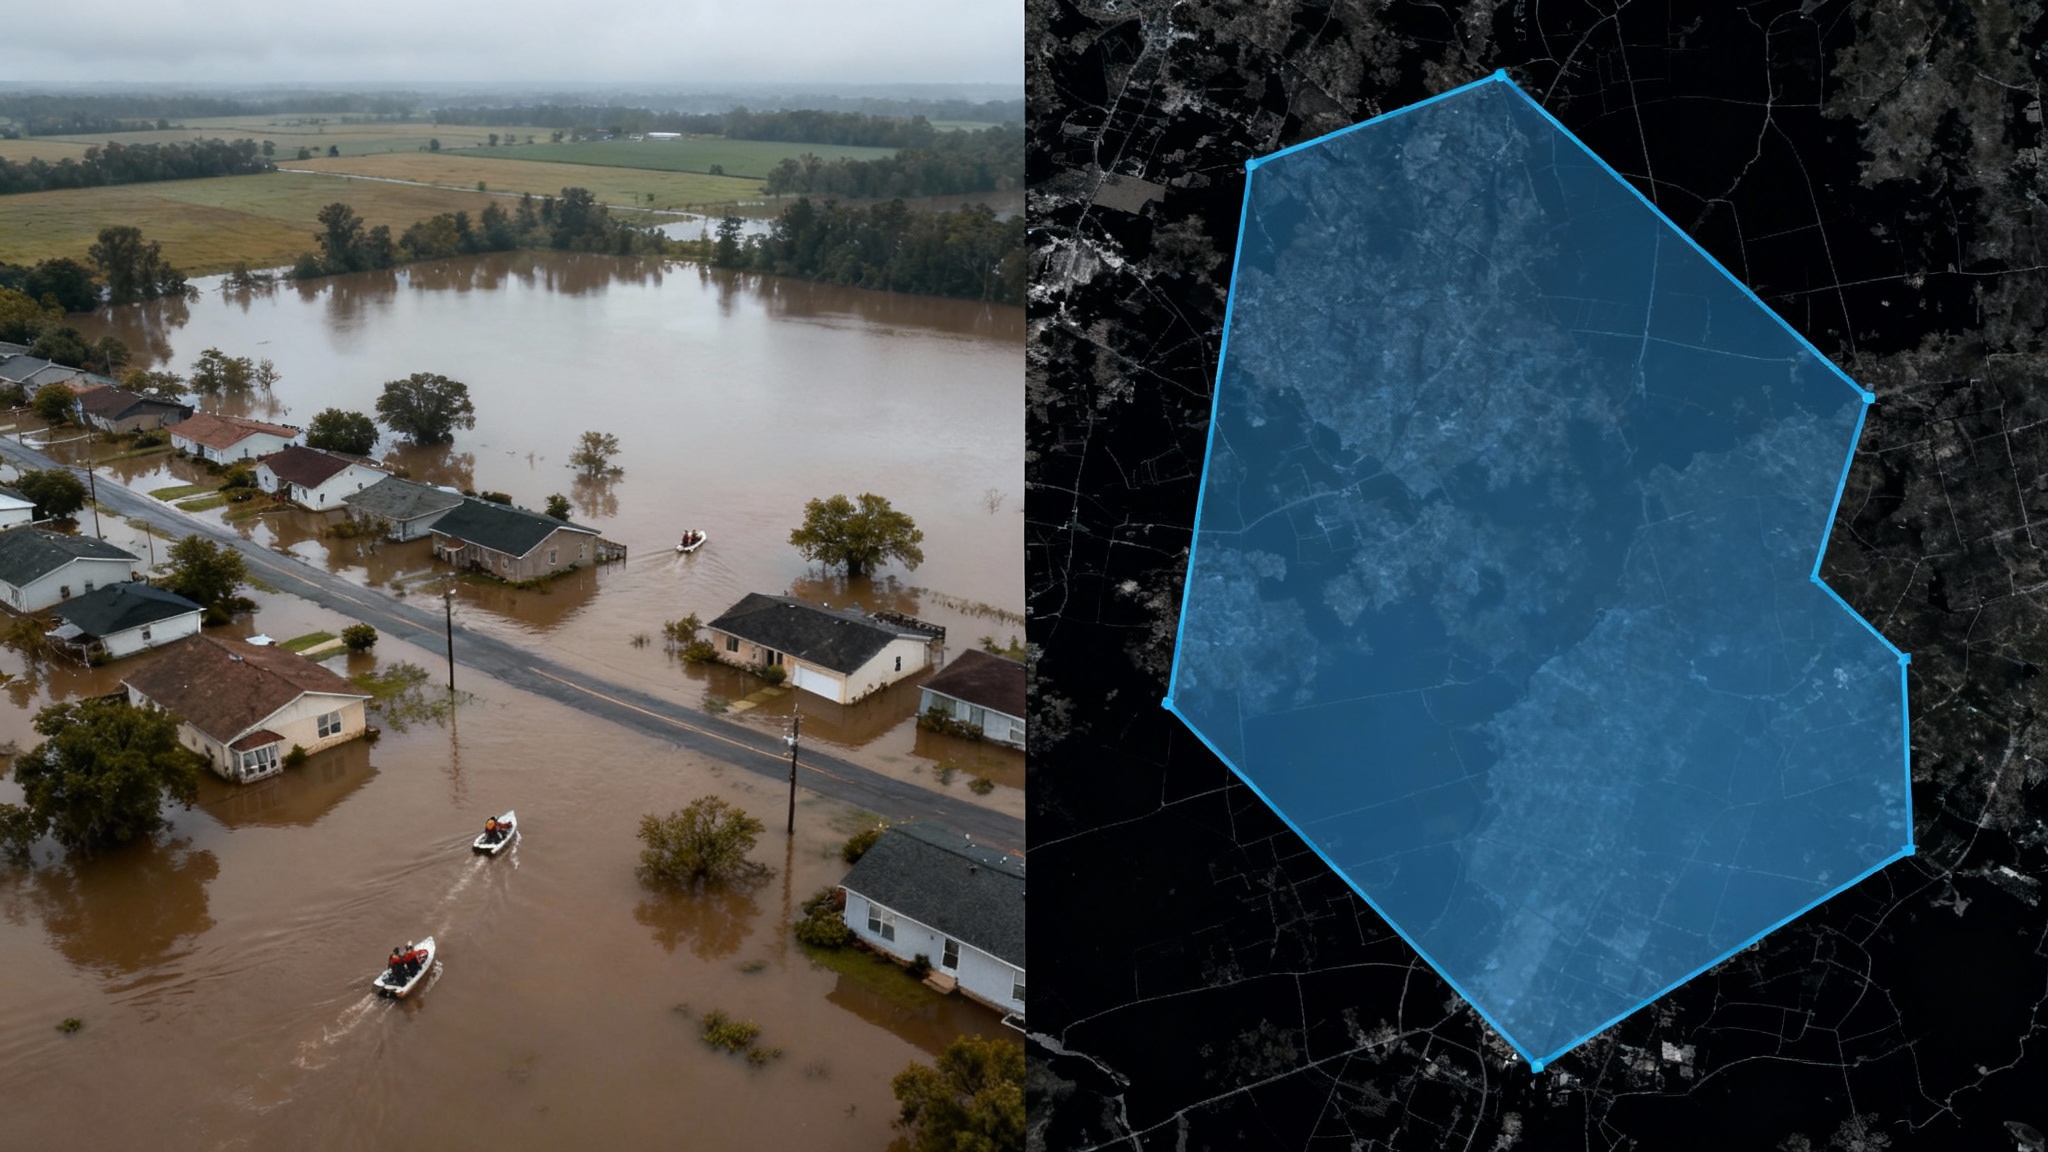
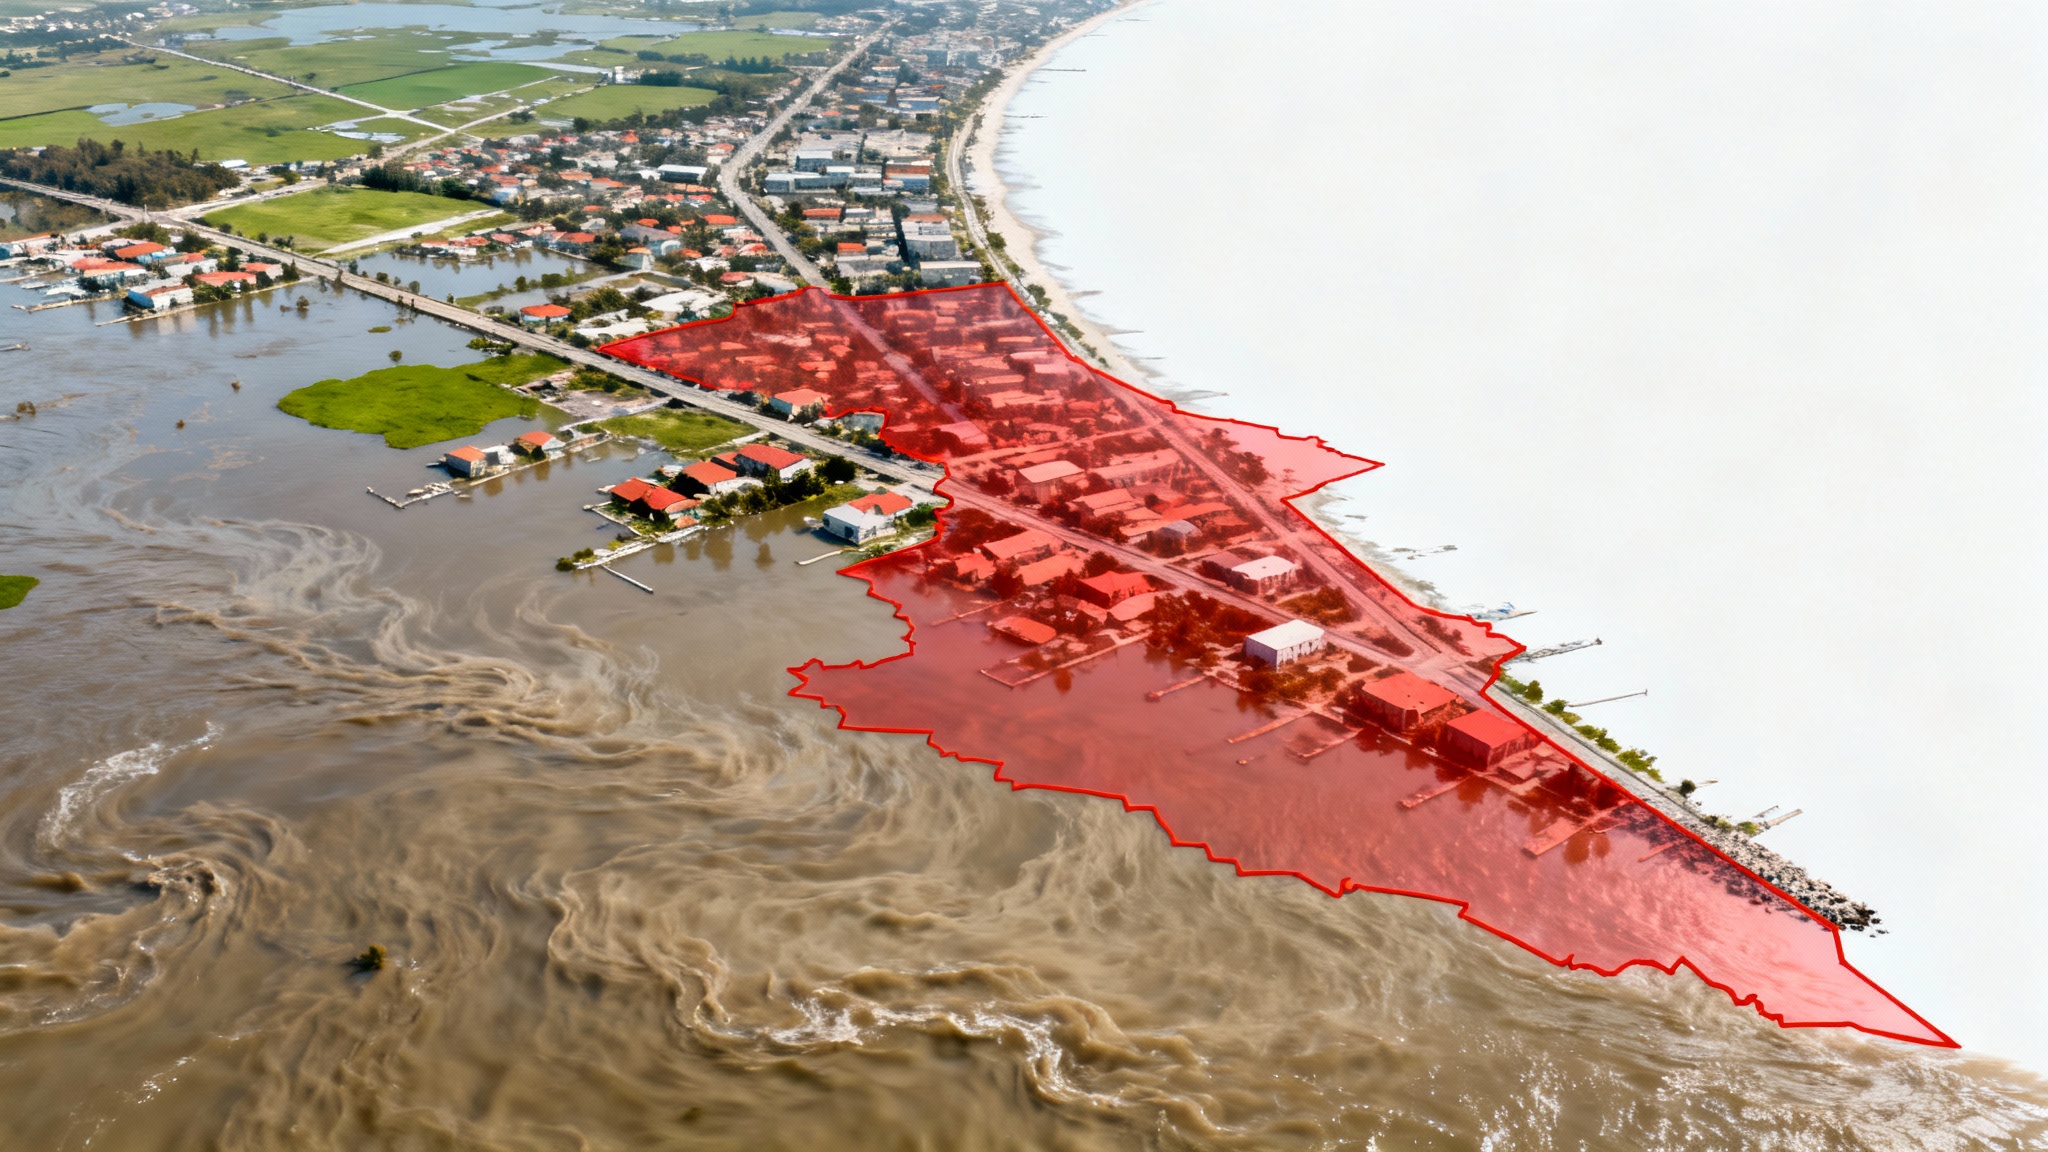
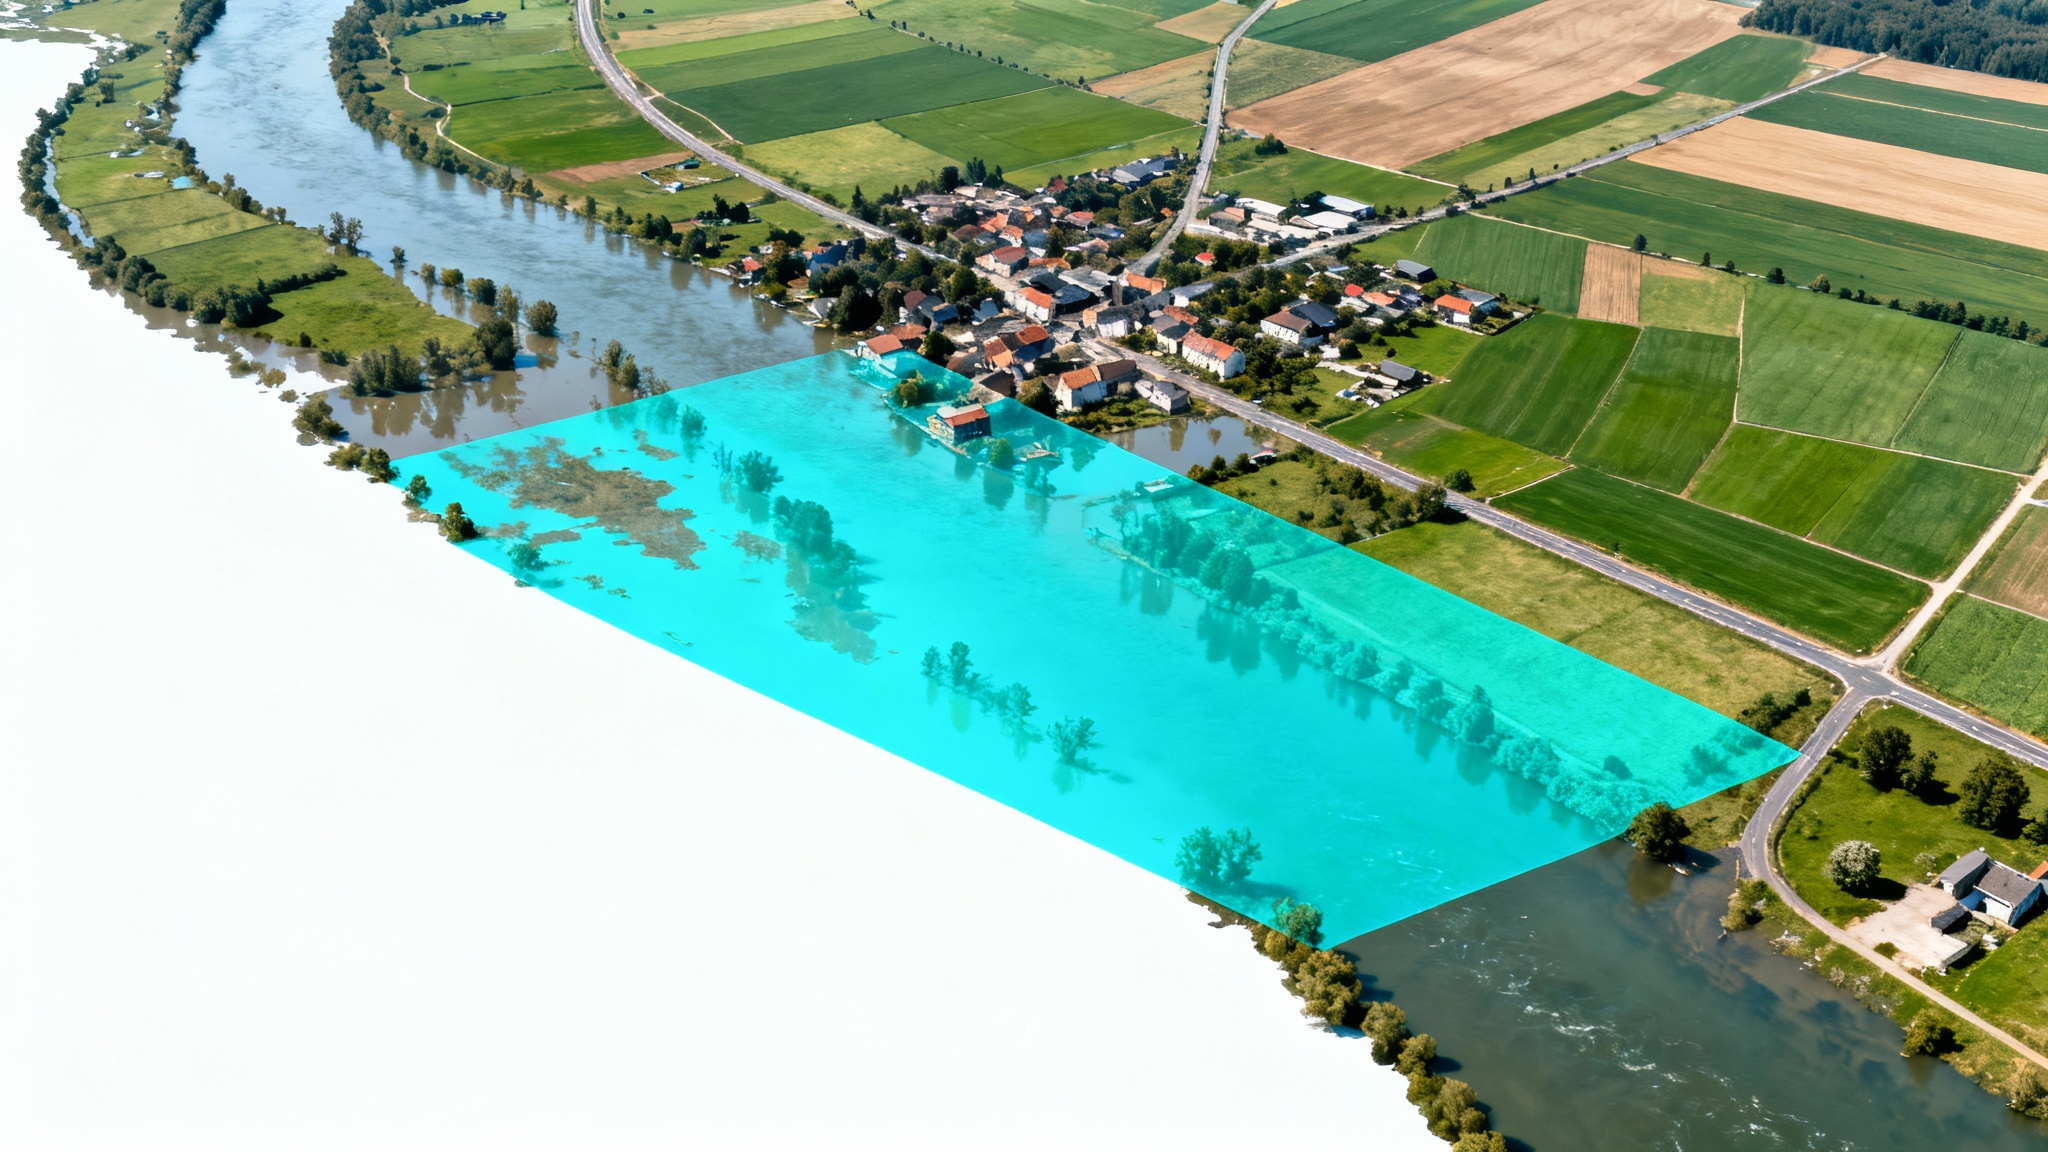
    Our AI will process the image based on your prompt, identify the water boundaries, and create a visual map of the flood's extent.

  4. 4

    Download Your Analysis

    Your flood extent map is ready to download as a watermark-free, high-resolution PNG file. Use it for analysis, reporting, or planning.
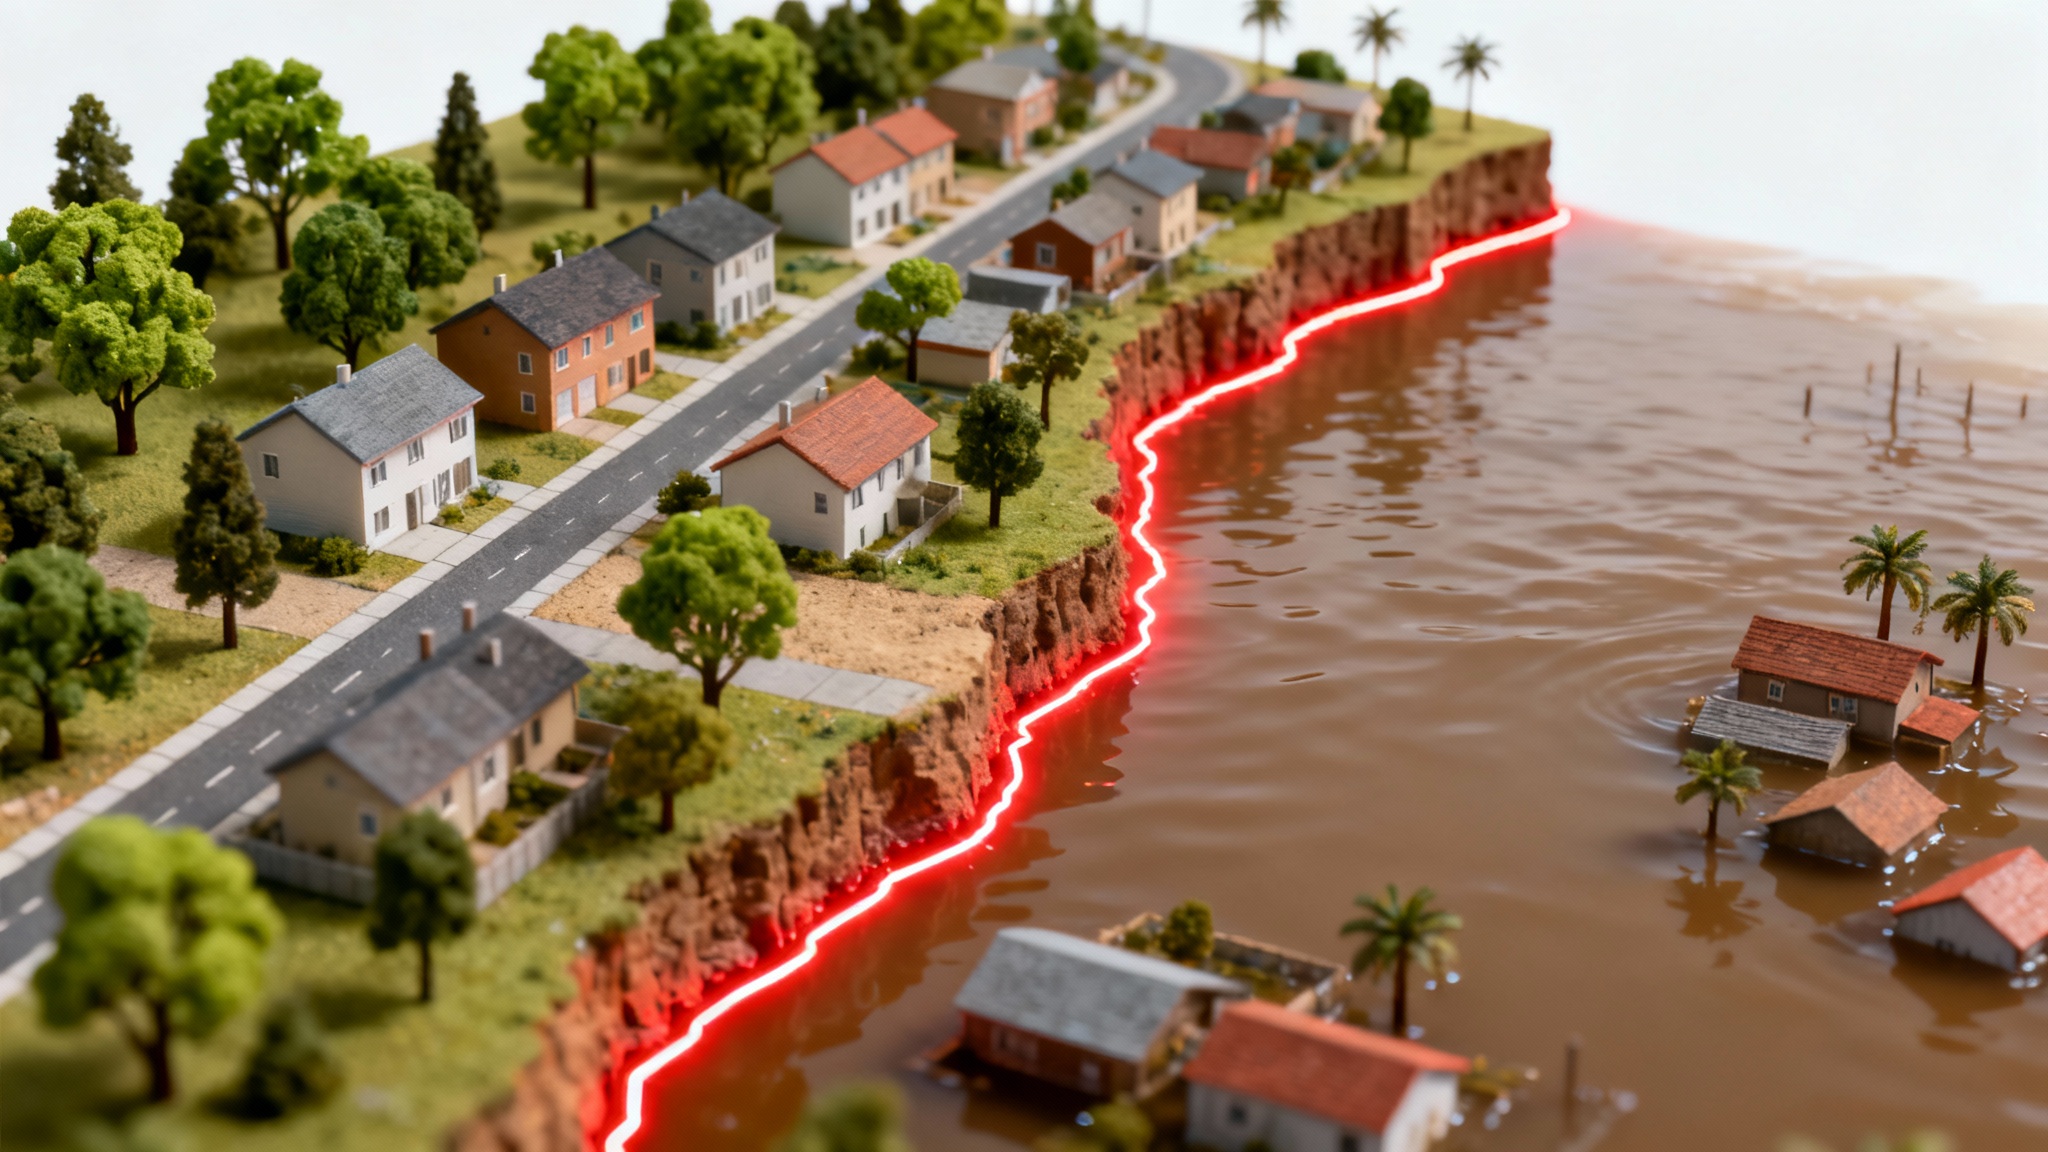
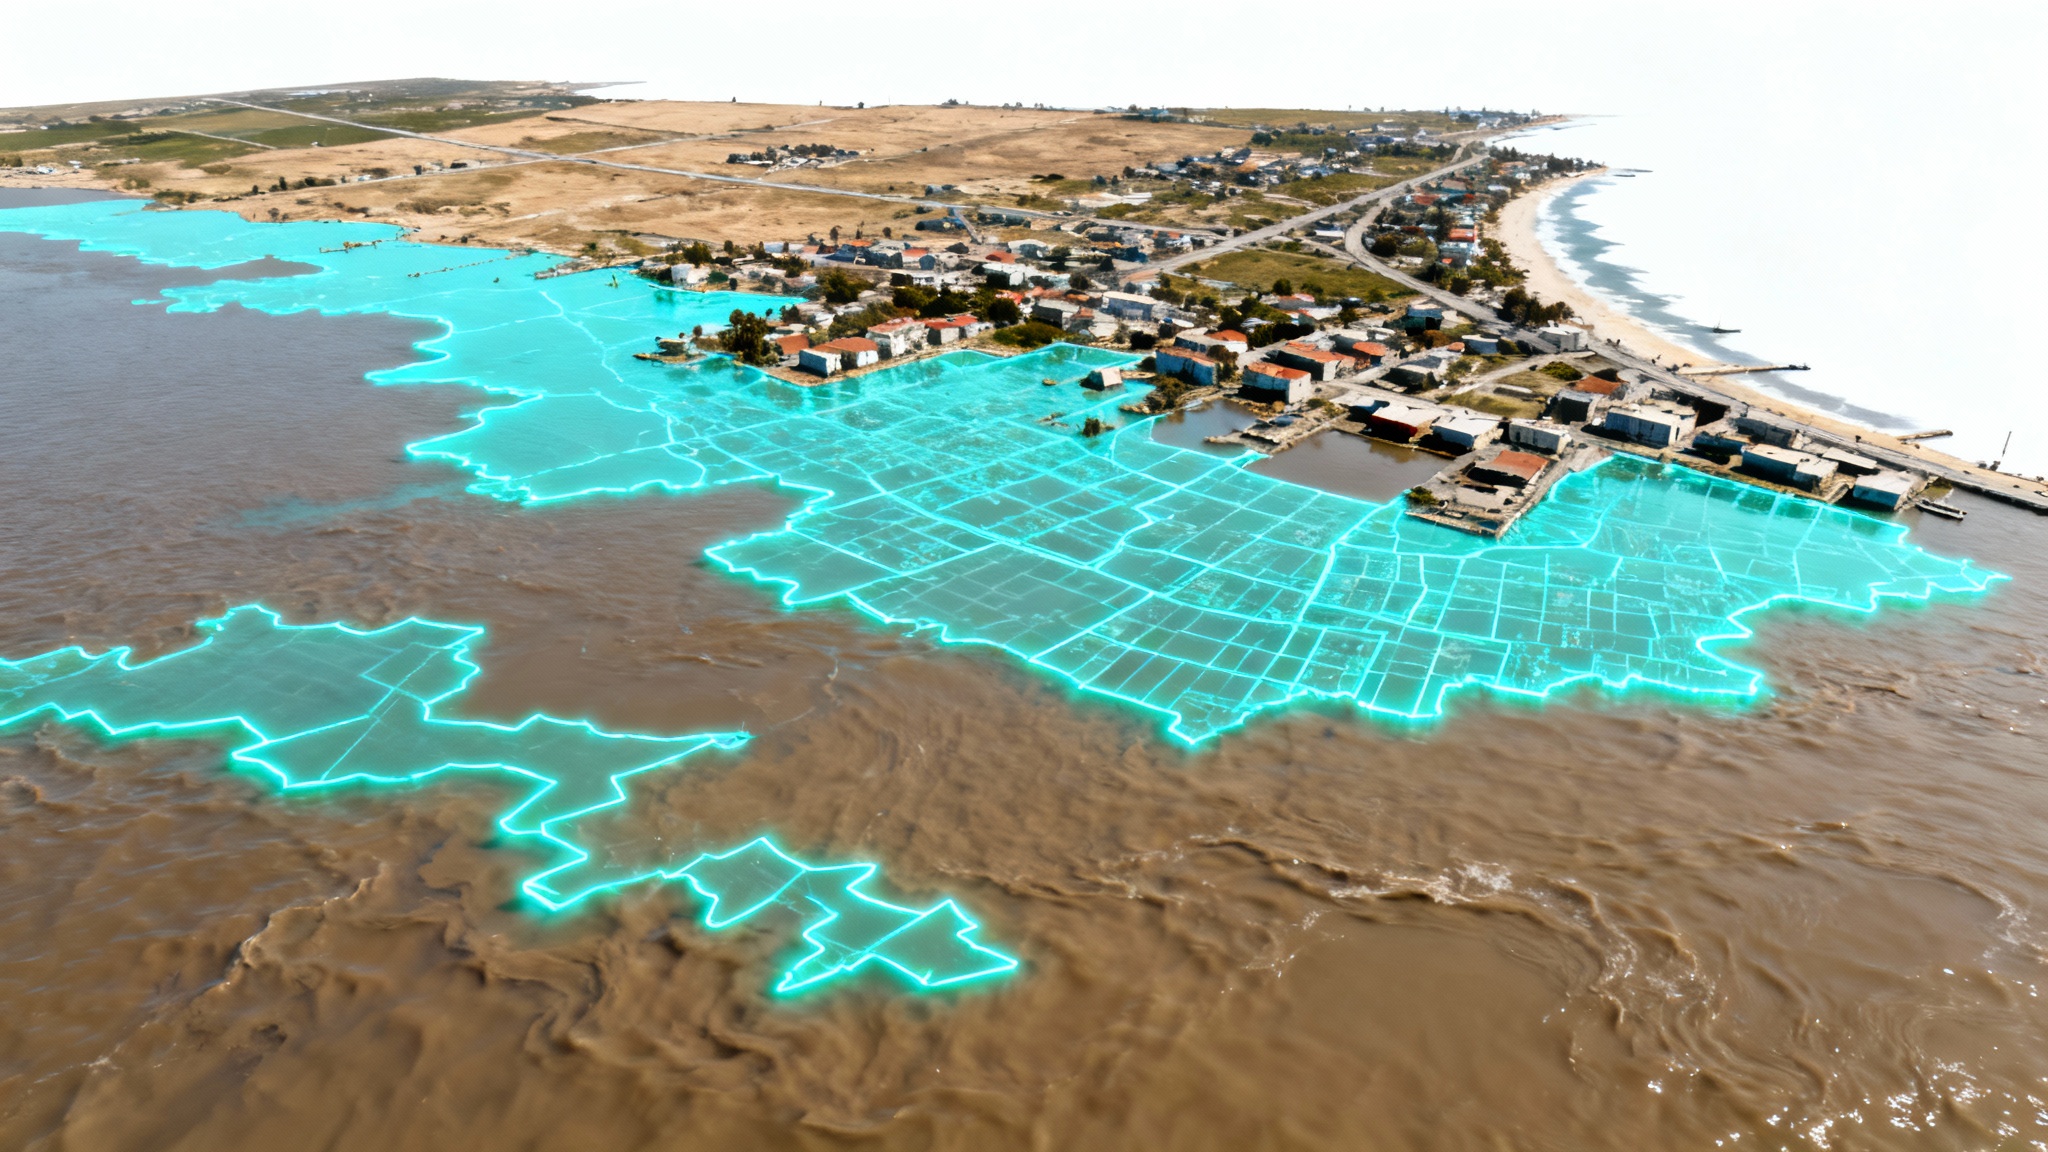
Get critical information fast when every second counts. Our AI tool processes aerial imagery from satellites or drones to produce flood extent maps in moments, not hours. This speed allows emergency response teams, government agencies, and infrastructure managers to gain immediate situational awareness. By simply uploading an image of an affected area, you can bypass traditional, time-consuming analysis methods. This rapid assessment helps in deploying resources efficiently and making informed decisions to protect communities and vital assets during a crisis.

Rapid Flood Analysis from Any Imagery

A high-angle mockup of a flood extent map, showing a satellite image of a flooded city with a precise red overlay highlighting the inundated areas, presented on a white background.
Our AI is trained to precisely identify and delineate the boundaries between land and water, even in complex scenarios with partial submersion or challenging lighting. This accuracy is key for creating reliable flood maps that reflect the true scope of an inundation event. Use these detailed visualizations for damage assessments, insurance claim processing, or environmental impact studies. The clarity provided by the AI-driven analysis ensures that you are working with trustworthy data for your planning and response efforts, leading to more effective outcomes.

Accurate Water Boundary Detection

A detailed aerial map visualizing flood extent, with the flooded areas of a town and countryside clearly marked with a blue overlay, on a white background.
You don't need to be a GIS expert to map flood data anymore. Our conversational AI agent makes flood extent mapping accessible to everyone. Forget about complicated software and extensive training. All you need to do is upload your aerial photograph and type a simple instruction. The tool handles the complex task of identifying water bodies and generating a clear visual map. This empowers local officials, journalists, and community leaders to quickly produce their own flood analyses and communicate the situation effectively to the public.

Simplify Complex Geospatial Analysis

An aerial view of a flooded town, with a bright blue digital line clearly mapping the extent of the floodwaters against the dry land, on a white background.
It’s Fast: Transform drone or satellite photos into actionable flood maps in seconds. It’s Easy to Use: No specialized GIS software needed. Just upload an image and provide a text prompt to guide the AI. It’s AI-Powered: Leverage advanced algorithms to automatically detect and outline floodwaters for precise analysis. It’s Shareable: Download your flood map as a high-resolution PNG file, perfect for reports, presentations, and online sharing to keep stakeholders informed and aligned.

Why use Pixelcut's AI flood extent mapping?

A 3D map diorama showing a coastal town partially flooded, with a clear red line marking the exact extent of the floodwater, isolated on a white background.
Emergency Management: Quickly assess the scale of a flood to coordinate rescue operations and allocate resources where they are most needed. Insurance and Risk Assessment: Accelerate claims processing by verifying the extent of flood damage to properties with clear visual evidence. Urban and Environmental Planning: Analyze historical flood data and potential future scenarios to develop more resilient infrastructure and land use policies. Journalism and Reporting: Create compelling, data-driven visuals to report on natural disasters and inform the public.

Flood Extent Mapping Use Cases

A top-down satellite map of a flooded town, shown against a white background. A bright blue digital layer is drawn over the flooded areas, illustrating flood extent mapping.

よくある質問

Pixelcutは200万人以上に愛されています

  • 私のお気に入りのアプリ

    素晴らしいアプリ、使いやすい。中小企業がさまざまなマーケティング資料を専門的に作成するための時間と費用を節約できるようになります。ありがとう。
    シェイリン D.
  • 最高の背景除去剤

    私の仕事には優れた背景除去剤が必要で、私はそれをすべて経験してきました。これは今のところ最高です。使い方はとても簡単で、結果は常に素晴らしいものになります。ピクセルカットさん、ありがとうございます!
    キラ・H
  • 大好きです

    驚くほど簡単で、バッグやアクセサリーに完璧な結果が得られます。プロのカメラマンが撮影したようです。
    メアリー J.