私のお気に入りのアプリ
素晴らしいアプリ、使いやすい。中小企業がさまざまなマーケティング資料を専門的に作成するための時間と費用を節約できるようになります。ありがとう。
Start by writing a clear description of the infographic you want to create. Include the topic, key data, and any specific icons or colors you have in mind.
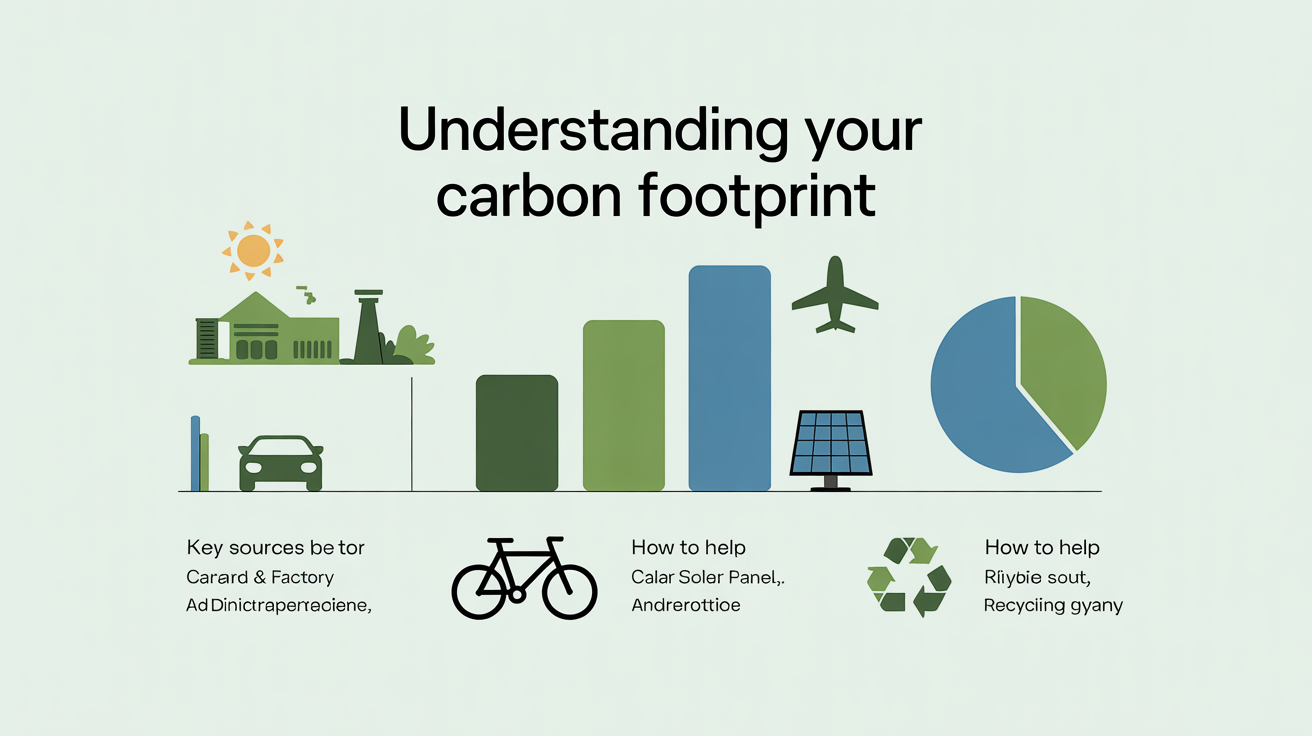
Click the generate button and our AI will interpret your prompt to design a custom carbon footprint infographic based on your description.
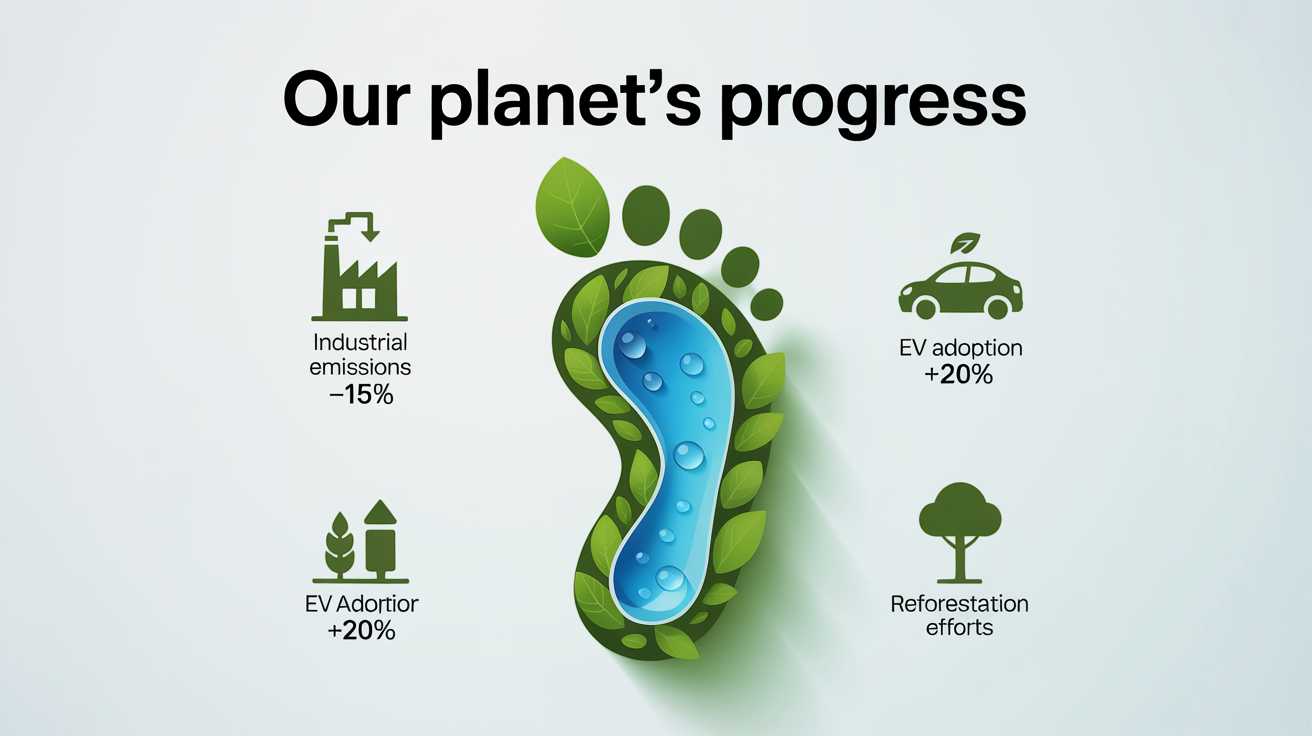
Your high-resolution infographic is ready to download. Use it to raise awareness in presentations, reports, or on social media.
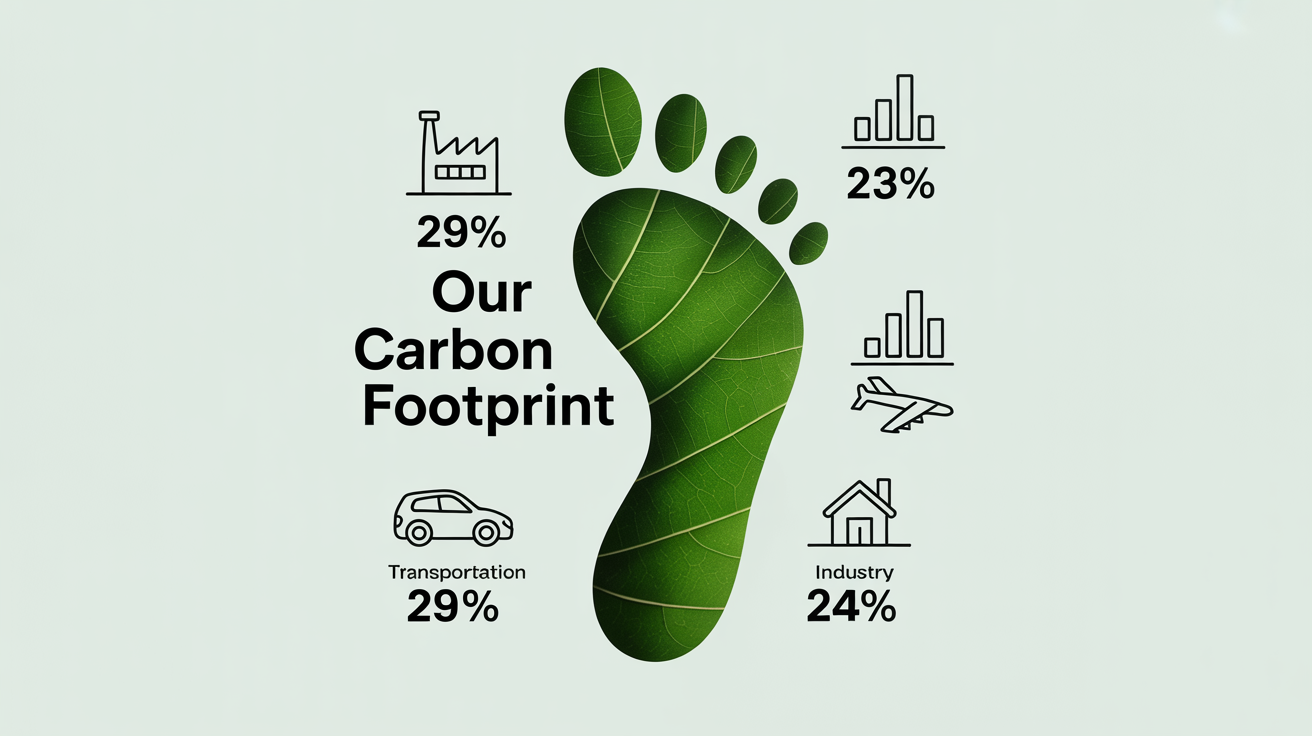
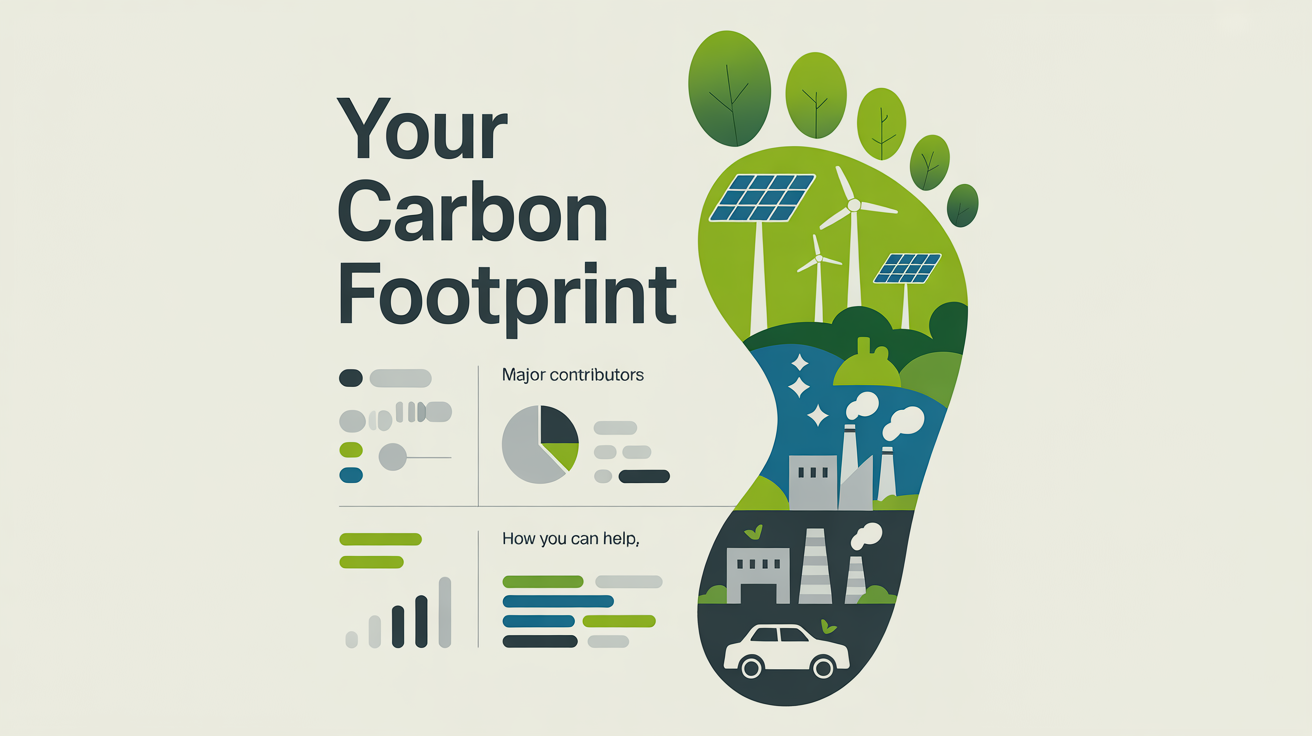
It is a tool that uses artificial intelligence to create infographics about environmental topics from text descriptions. You describe the data, icons, and style you want, and the AI generates a visual representation for you.
For best results, describe the main message, key statistics, and visual elements you want. For example, mention specific icons (like cars, factories, or recycling symbols), a color scheme (e.g., 'green and blue tones'), and the overall layout.
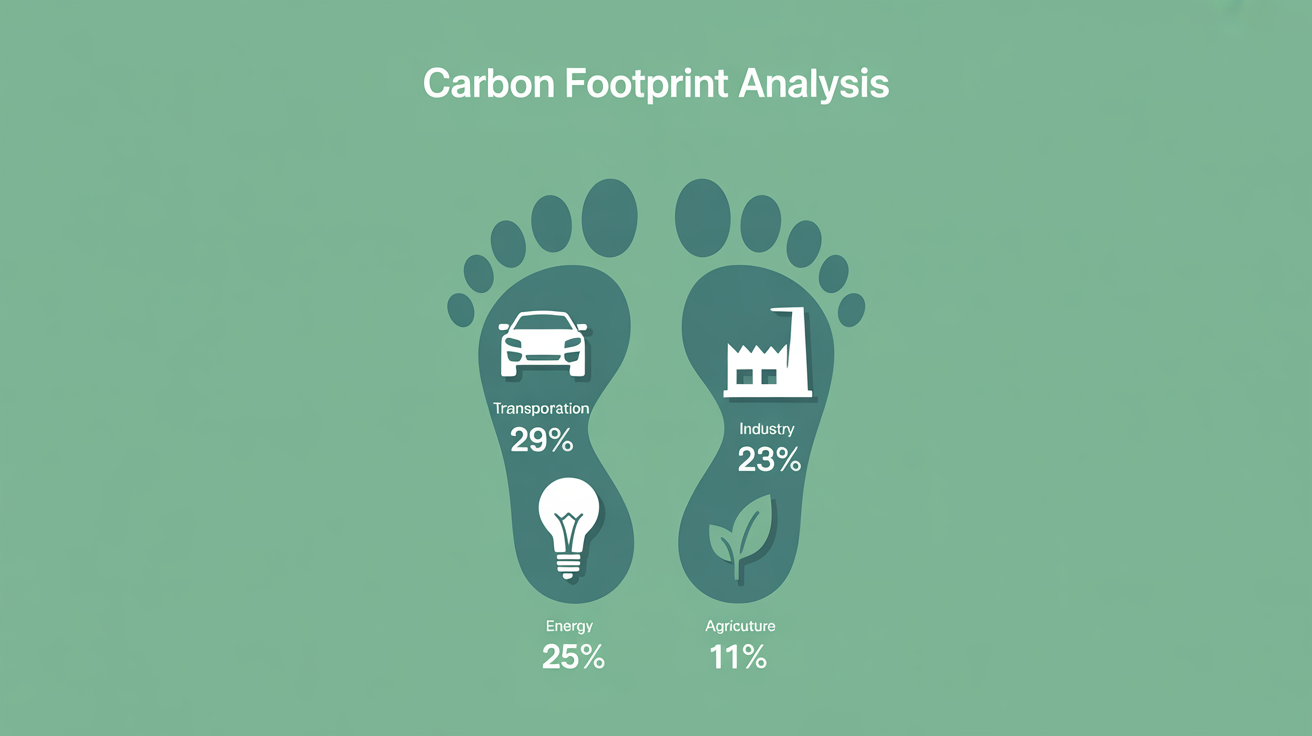
Yes, you can include your own statistics and data points directly in the text prompt. The AI will integrate this information into the visual design it creates.
Absolutely. It's an excellent tool for students to visualize data for presentations and reports on environmental topics, helping to make their projects more engaging and informative.
Yes. While it's great for carbon footprints, you can use the generator to create infographics on a wide range of topics, such as recycling, water conservation, biodiversity, or renewable energy.
Not at all. The tool is designed for everyone, regardless of design skill. All you need is your idea; the AI handles the visual creation process for you.
素晴らしいアプリ、使いやすい。中小企業がさまざまなマーケティング資料を専門的に作成するための時間と費用を節約できるようになります。ありがとう。
私の仕事には優れた背景除去剤が必要で、私はそれをすべて経験してきました。これは今のところ最高です。使い方はとても簡単で、結果は常に素晴らしいものになります。ピクセルカットさん、ありがとうございます!
驚くほど簡単で、バッグやアクセサリーに完璧な結果が得られます。プロのカメラマンが撮影したようです。