私のお気に入りのアプリ
素晴らしいアプリ、使いやすい。中小企業がさまざまなマーケティング資料を専門的に作成するための時間と費用を節約できるようになります。ありがとう。
Start by writing a detailed description of your sustainability topic. Include key data, statistics, and any specific colors or icons you want.
Click the generate button, and our AI will instantly translate your text into a custom infographic, handling the layout and visualization for you.
Your high-resolution infographic is ready to download as a PNG. Use it in presentations, reports, or social media to spread awareness.
An AI sustainability infographic generator is a tool that uses artificial intelligence to create infographics about environmental topics from text descriptions. You can provide details about your data, preferred style, and key message, and the AI will design a unique visual for you.
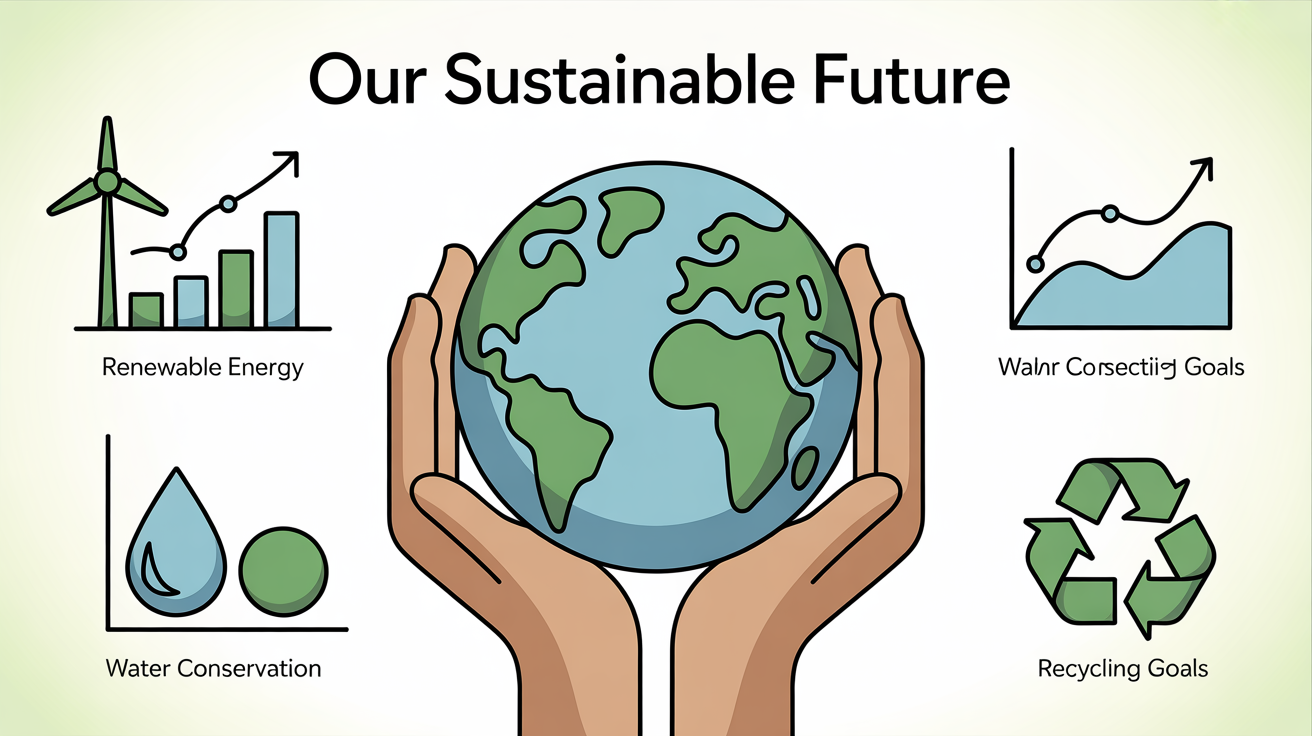
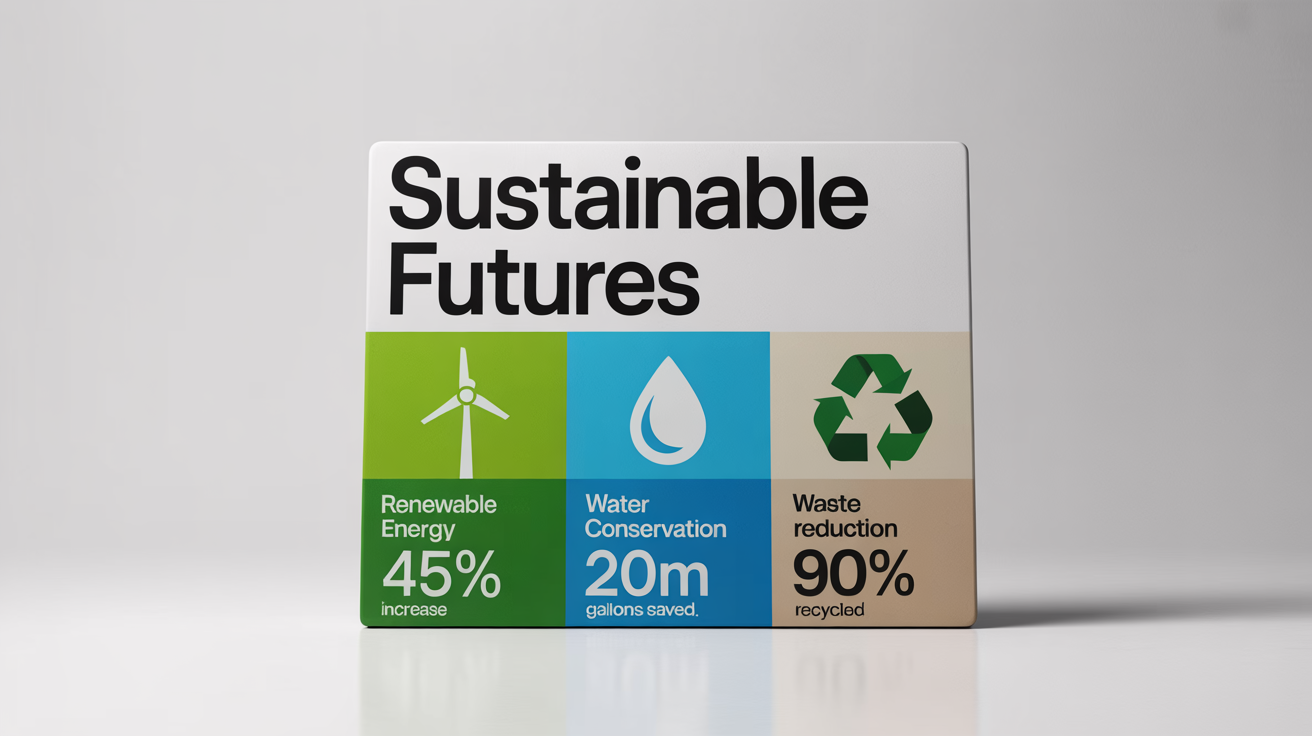
For the best results, include the main topic, specific data points or statistics, the desired color palette (e.g., earth tones), and any icons or imagery you want to see. For example, you could describe 'an infographic showing the reduction in carbon emissions from 2020 to 2025 with a tree icon and a green color scheme'.
Yes, the infographics you create are free to use for both personal and commercial projects. They are ideal for corporate sustainability reports, marketing materials, and educational content.
Not at all. The tool is designed for everyone, regardless of design experience. The AI handles all the complex design work, from layout to icon selection, based on your simple text prompt.
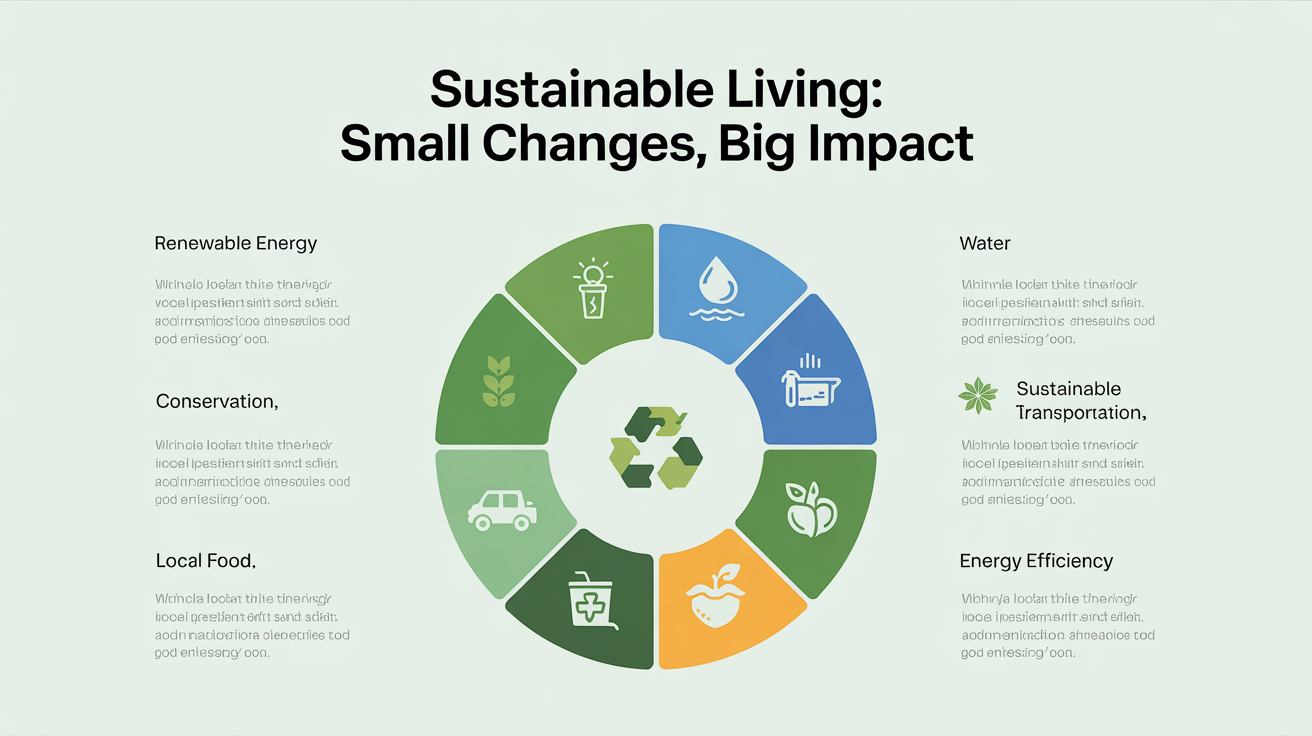
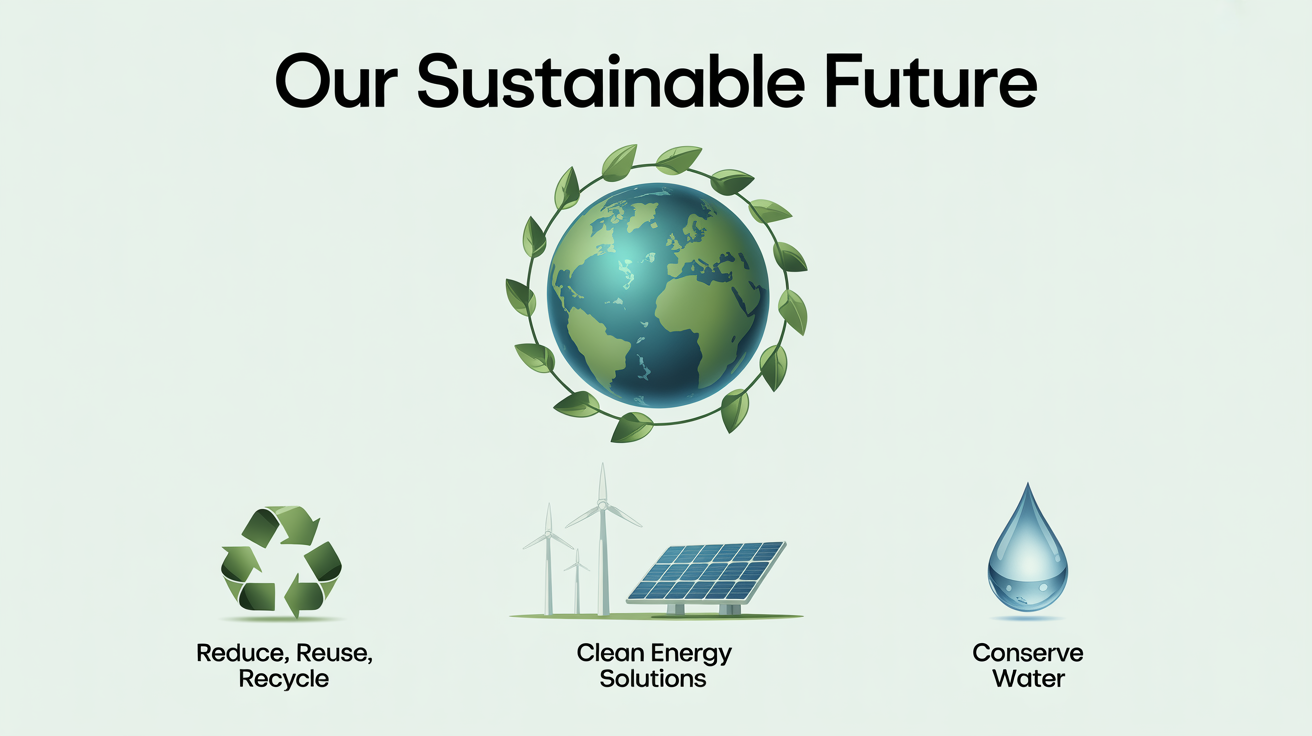
You can create infographics on a wide range of sustainability and environmental topics, including renewable energy, waste management, water conservation, climate change statistics, biodiversity, eco-friendly practices, and corporate social responsibility initiatives.
Infographics simplify complex information, making it easier for audiences to understand and engage with. By using visual elements like charts and icons, they can effectively tell a story about a company's or community's environmental impact and progress.
素晴らしいアプリ、使いやすい。中小企業がさまざまなマーケティング資料を専門的に作成するための時間と費用を節約できるようになります。ありがとう。
私の仕事には優れた背景除去剤が必要で、私はそれをすべて経験してきました。これは今のところ最高です。使い方はとても簡単で、結果は常に素晴らしいものになります。ピクセルカットさん、ありがとうございます!
驚くほど簡単で、バッグやアクセサリーに完璧な結果が得られます。プロのカメラマンが撮影したようです。