私のお気に入りのアプリ
素晴らしいアプリ、使いやすい。中小企業がさまざまなマーケティング資料を専門的に作成するための時間と費用を節約できるようになります。ありがとう。
In the prompt box, write a clear description of your database. Include the entities, their attributes, and the relationships between them.
Click the generate button. The AI will process your text and create a visual representation of your database structure in just a few moments.
Your high-resolution ERD is ready to be downloaded as a PNG file. It's watermark-free and suitable for any professional or academic use.
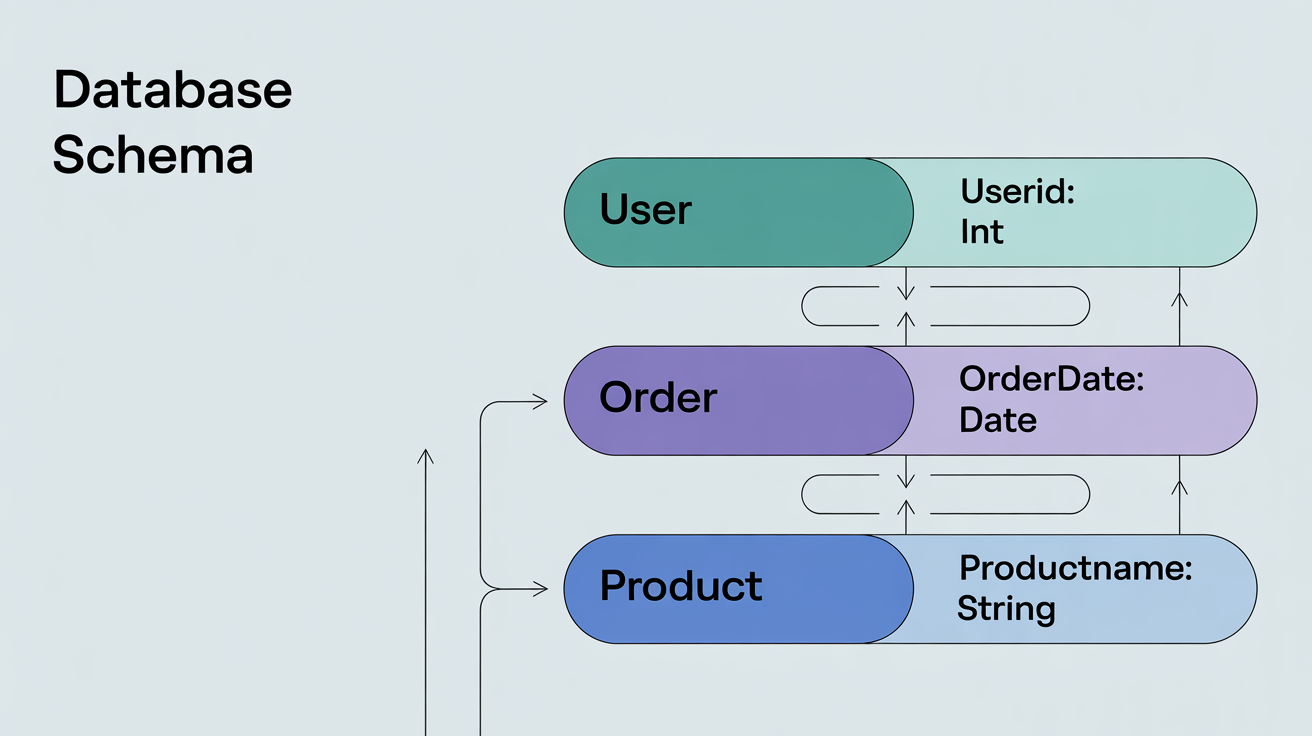
An AI entity relationship diagram generator is a tool that uses artificial intelligence to automatically create an ERD from a user's text description. You can specify the entities, attributes, and relationships, and the AI will produce a visual diagram of your database structure.
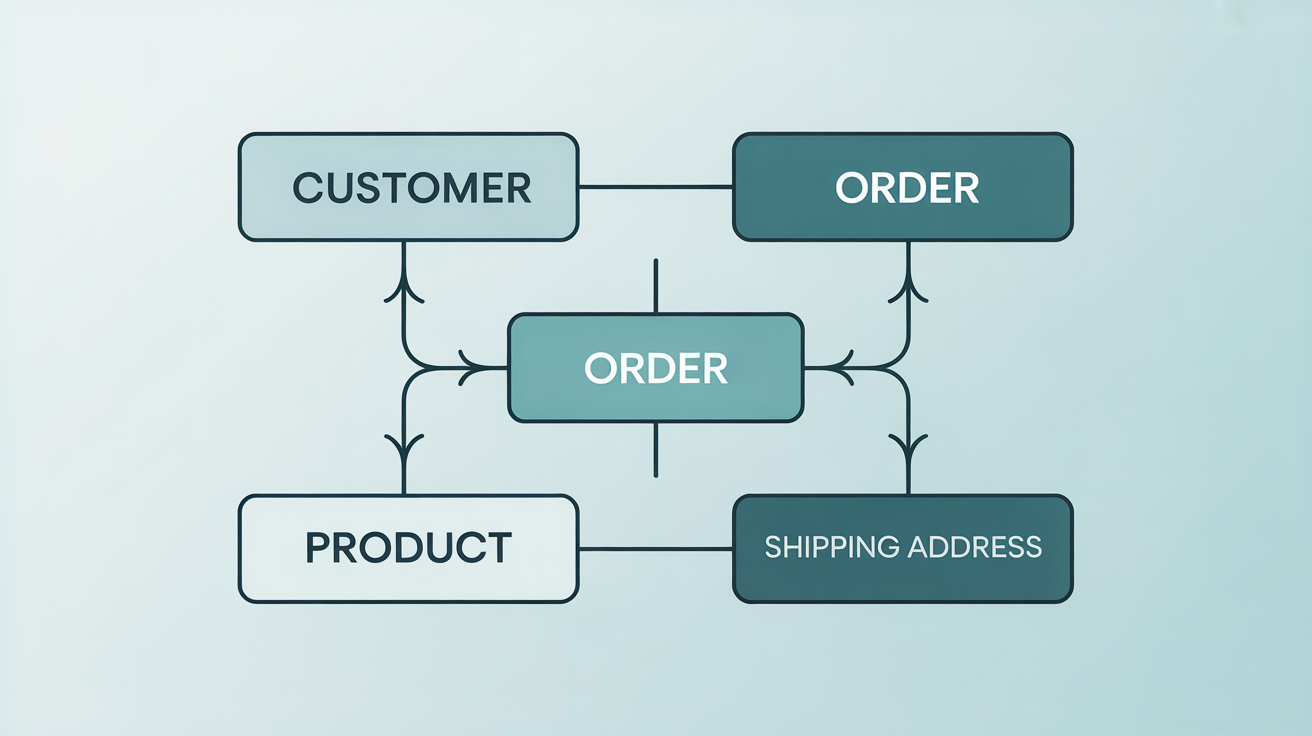
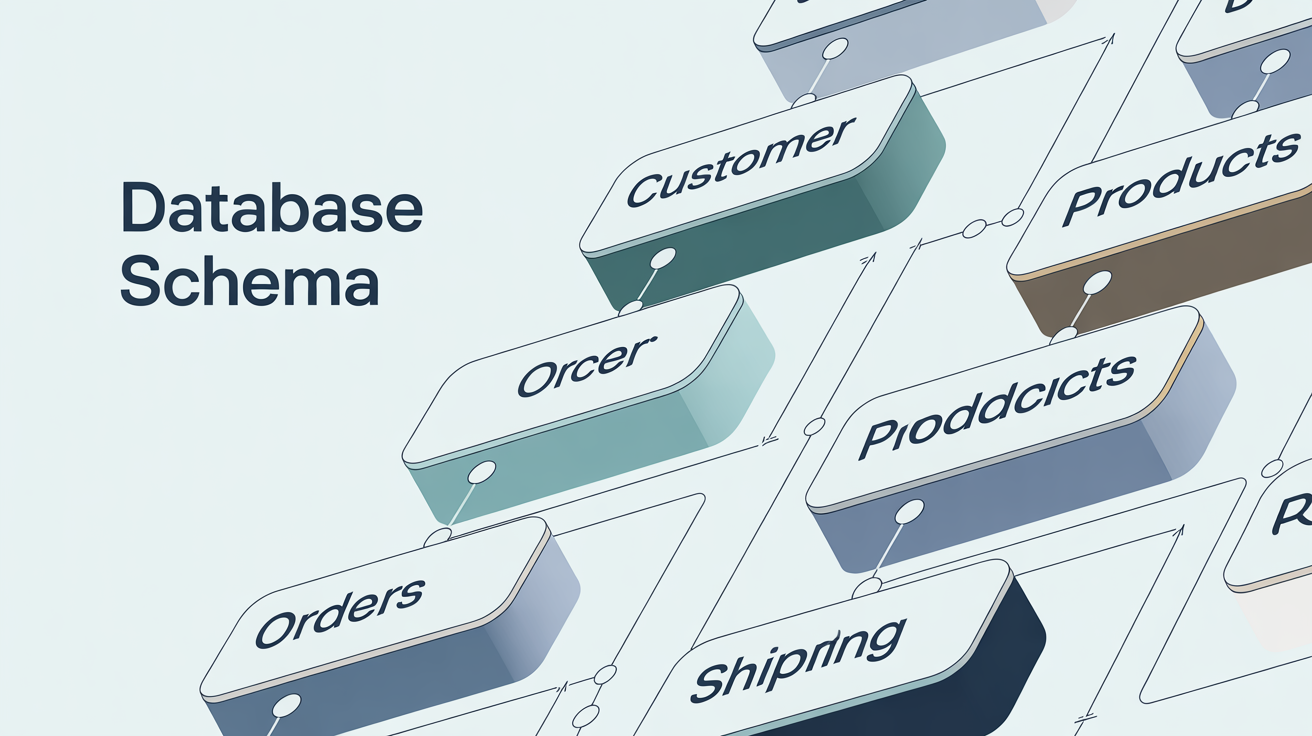
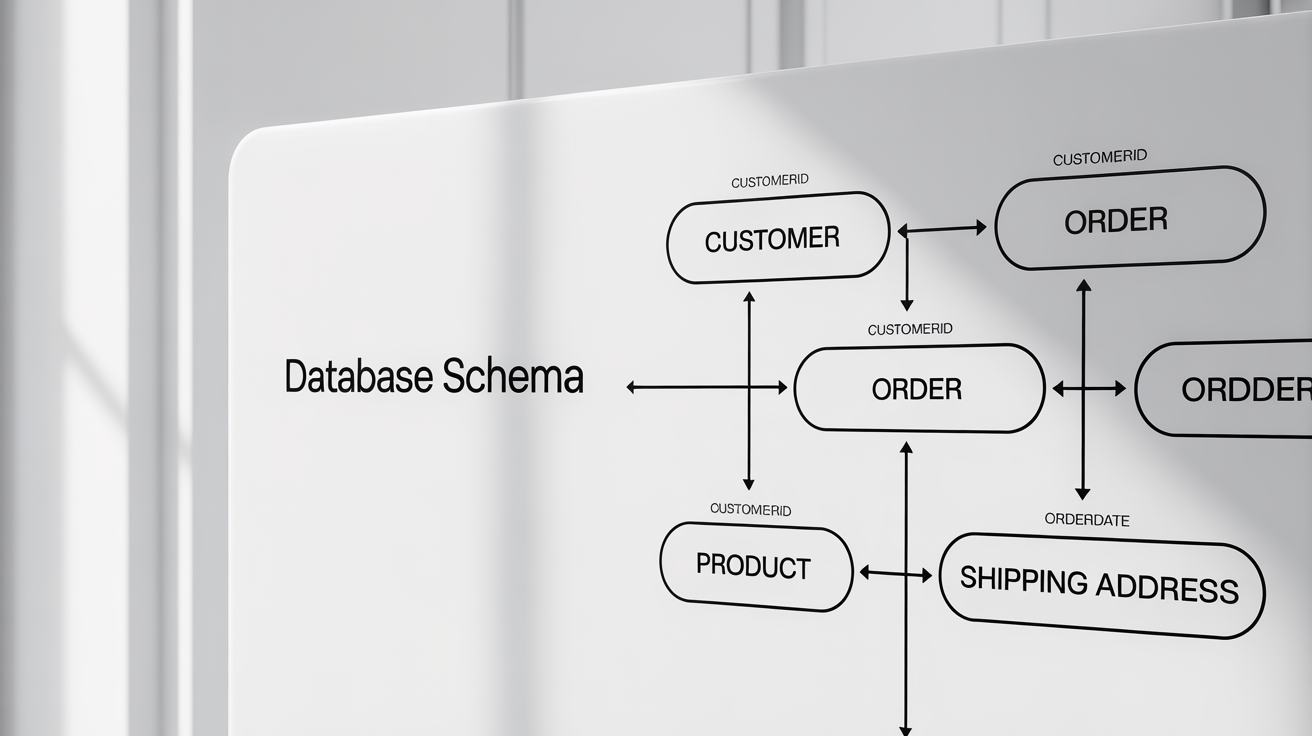
An ER diagram consists of three main components: Entities (objects or concepts like 'Customer' or 'Product'), Attributes (the properties of entities, such as 'Name' or 'Price'), and Relationships (how entities are connected, like a 'Customer' placing an 'Order').
You can describe the relationship in your text prompt. For example, you could write, "A Customer can have many Orders, but each Order belongs to only one Customer." The AI will interpret this to create a one-to-many relationship in the diagram.
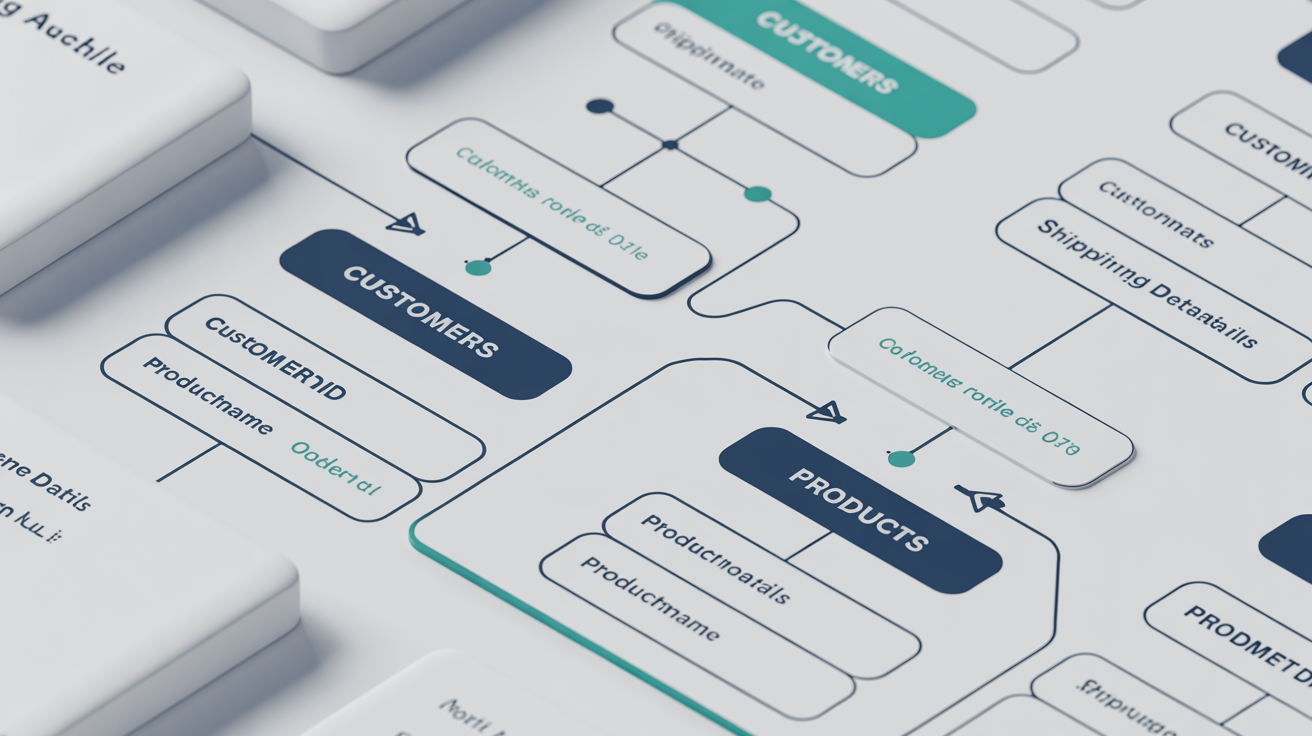
Yes. You can describe the schema of your existing database in the text prompt to generate a diagram. You can also upload an image of your current schema or a rough draft, and the AI can help visualize or refine it.
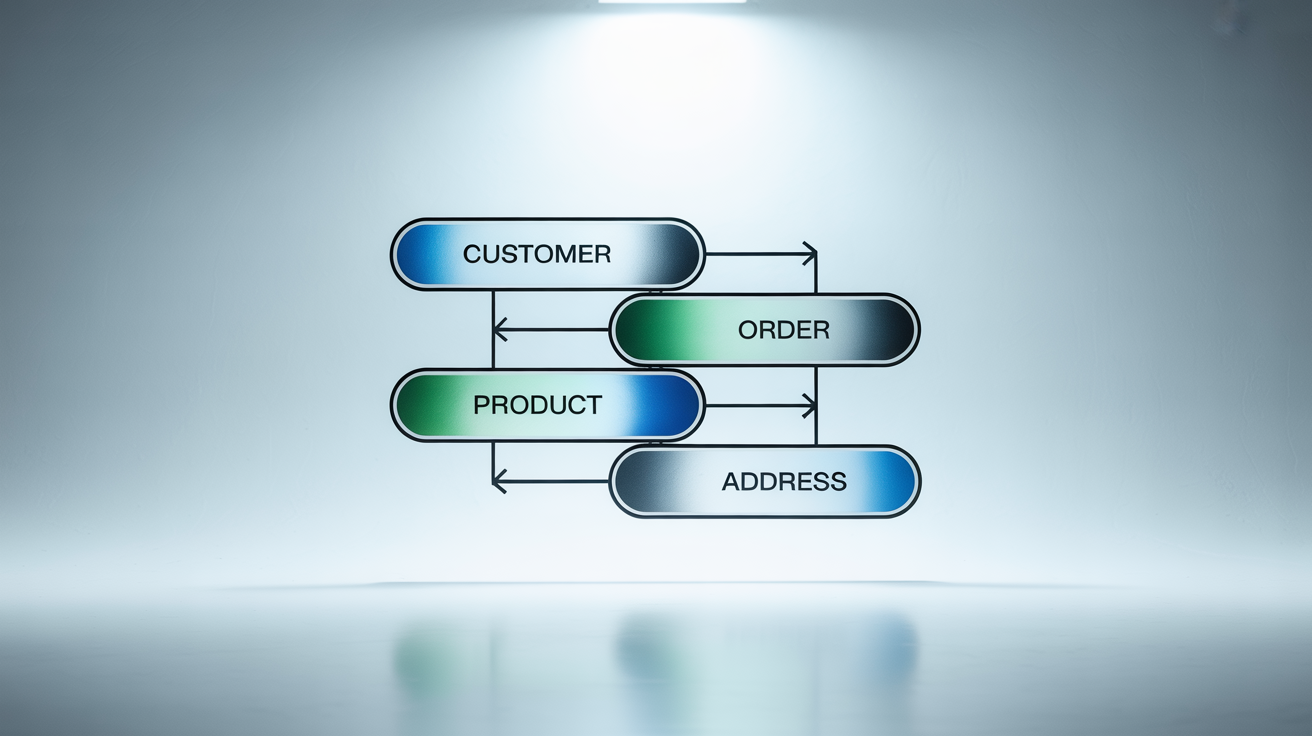
The diagrams are useful for a variety of purposes, including designing new databases, debugging existing ones, creating system documentation, and helping teams communicate about the database structure during software development.
No, you don't need to be a database expert or a designer. The tool is built to be intuitive. If you can describe the data you're working with in plain language, you can generate a professional ER diagram.
素晴らしいアプリ、使いやすい。中小企業がさまざまなマーケティング資料を専門的に作成するための時間と費用を節約できるようになります。ありがとう。
私の仕事には優れた背景除去剤が必要で、私はそれをすべて経験してきました。これは今のところ最高です。使い方はとても簡単で、結果は常に素晴らしいものになります。ピクセルカットさん、ありがとうございます!
驚くほど簡単で、バッグやアクセサリーに完璧な結果が得られます。プロのカメラマンが撮影したようです。