私のお気に入りのアプリ
素晴らしいアプリ、使いやすい。中小企業がさまざまなマーケティング資料を専門的に作成するための時間と費用を節約できるようになります。ありがとう。
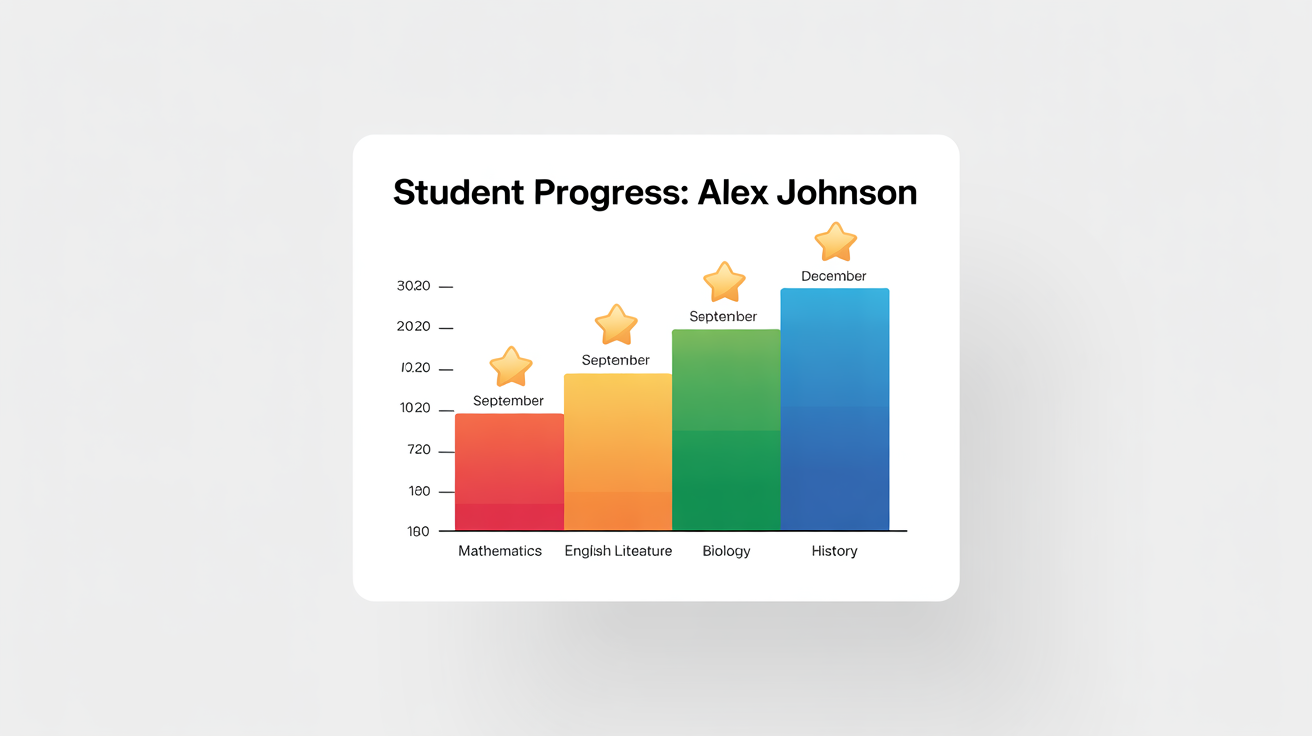
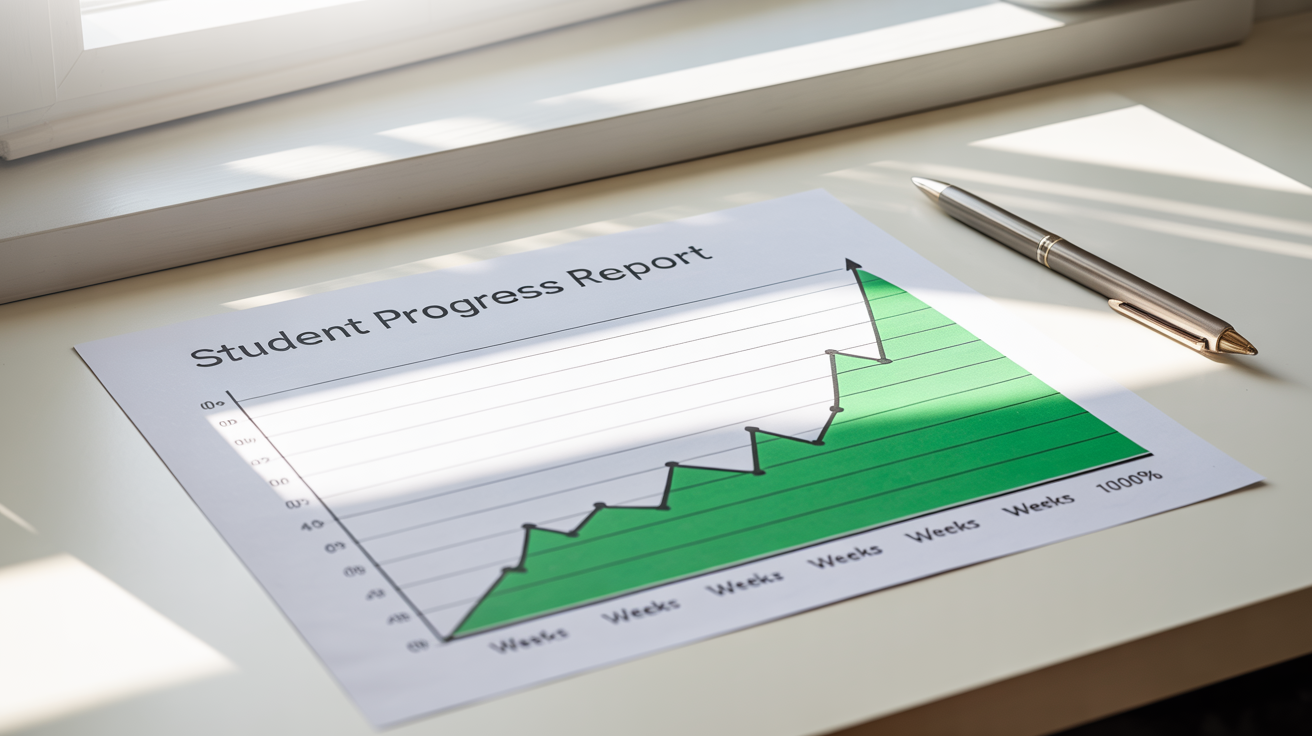
Start by describing the chart you need. Include the chart type, subjects, and scores. For example, 'Bar chart of weekly quiz scores: 95, 80, 88, 92'.
Click the generate button and let our AI build the chart for you. It will interpret your data and create a clean, accurate visualization in moments.
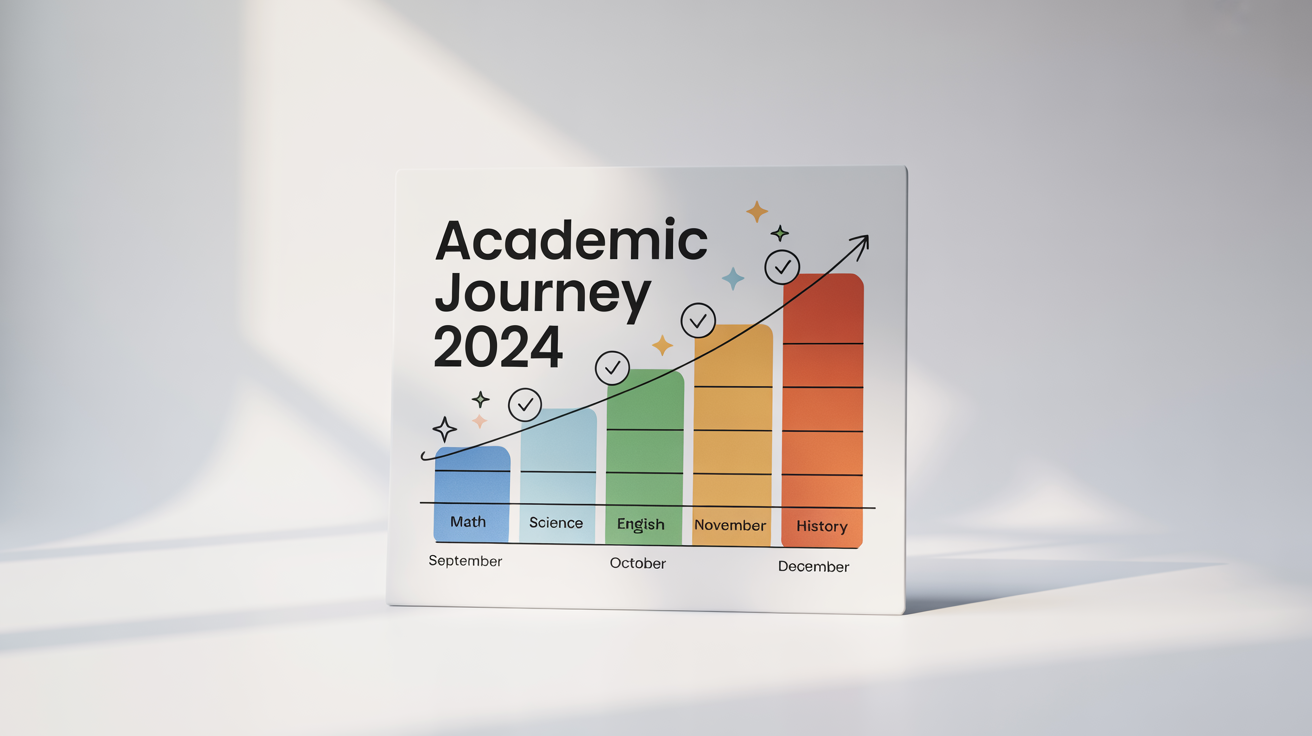
Your student progress chart is ready to be downloaded as a high-resolution PNG file. Use it for reports, presentations, or personal tracking.
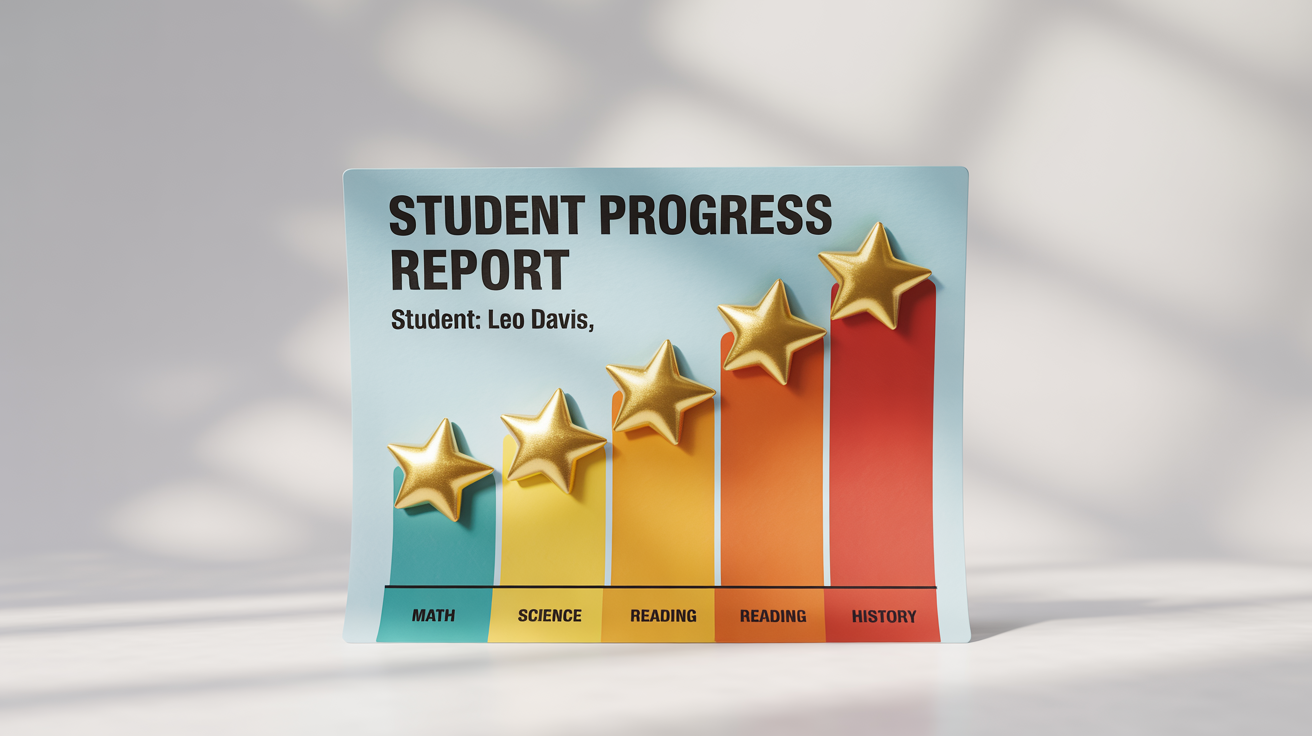
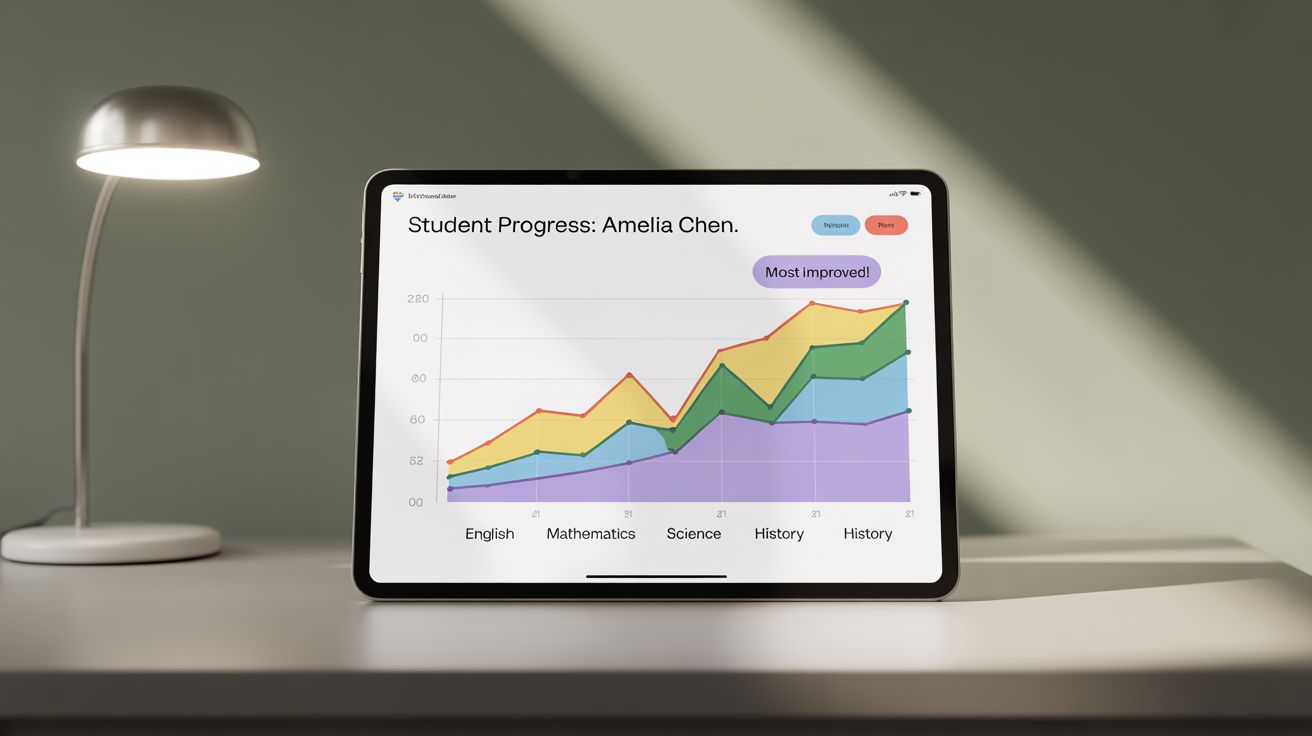
An AI student progress chart generator is a tool that uses artificial intelligence to automatically create visual charts from text descriptions. You can input student scores, subjects, and the desired chart type, and the AI will produce a visual representation of that data.
You can input the data directly into the text prompt. For the best results, specify the chart type, the labels, and the numerical data. For example: 'A line graph of science quiz scores: 65, 72, 85, 83, 90'.
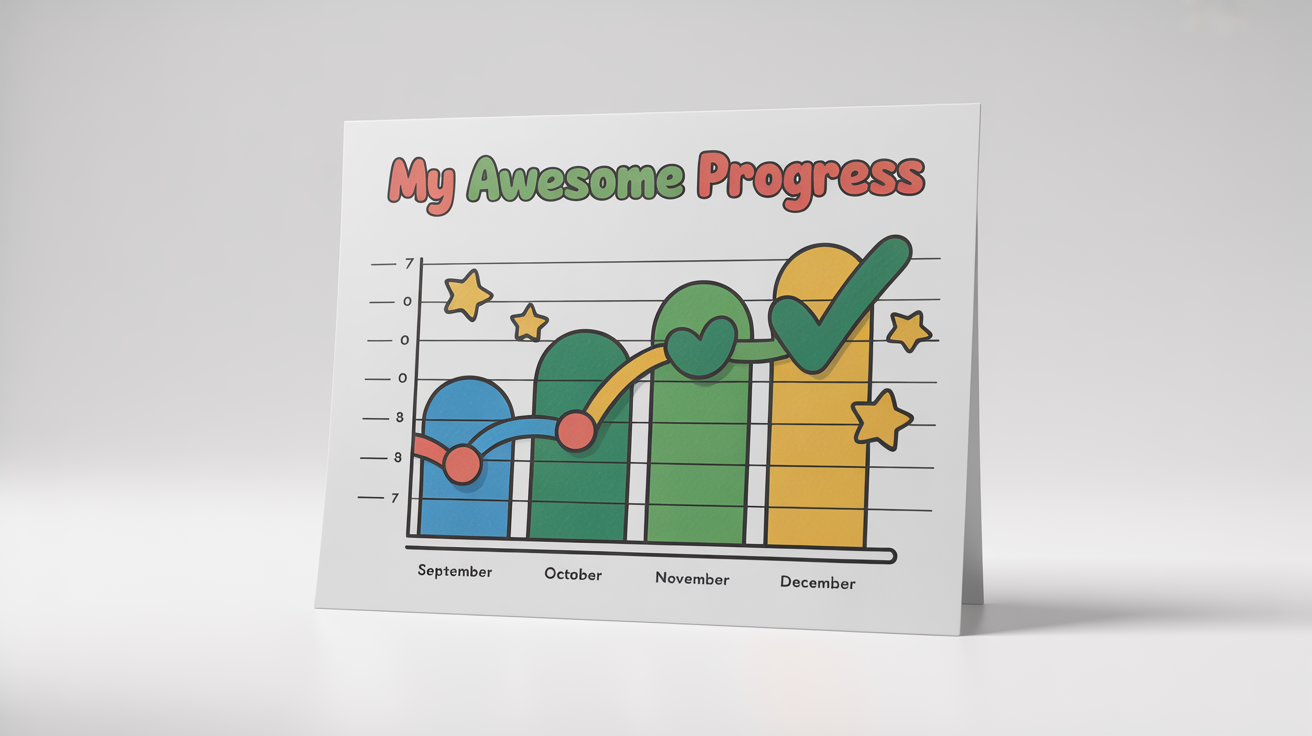
Yes, you can create various chart types. Simply state whether you want a 'line graph,' 'bar chart,' or another style in your prompt, and the AI will generate it based on your data. Line graphs are great for showing trends over time, while bar graphs are good for comparing categories.
Yes, the student progress chart generator is free to try. After using your initial free credits, you have the option to purchase more to continue creating charts.
Absolutely. You can include data for multiple subjects in a single prompt to compare them on the same graph. For example: 'A line graph comparing Math scores (80, 85, 90) and English scores (88, 86, 92) over three tests'.
All charts you create can be downloaded as high-resolution, watermark-free PNG files, ready for printing or digital use.
素晴らしいアプリ、使いやすい。中小企業がさまざまなマーケティング資料を専門的に作成するための時間と費用を節約できるようになります。ありがとう。
私の仕事には優れた背景除去剤が必要で、私はそれをすべて経験してきました。これは今のところ最高です。使い方はとても簡単で、結果は常に素晴らしいものになります。ピクセルカットさん、ありがとうございます!
驚くほど簡単で、バッグやアクセサリーに完璧な結果が得られます。プロのカメラマンが撮影したようです。