Pixelcut
A professionally designed infographic titled 'YOUR CARBON FOOTPRINT' showing a large footprint graphic split between green nature and gray pollution, surrounded by charts and text explaining the topic.

AI Carbon Footprint Infographic Generator

Trusted by 70 million people
171,800 Reviews
Developer API
Available on iPhone & Android

How to Create a Carbon Footprint Infographic

  1. 1

    Describe Your Infographic

    Start by writing a clear description of the infographic you want to create. Include the topic, key data, and any specific icons or colors you have in mind.

  2. 2

    Generate Your Visual

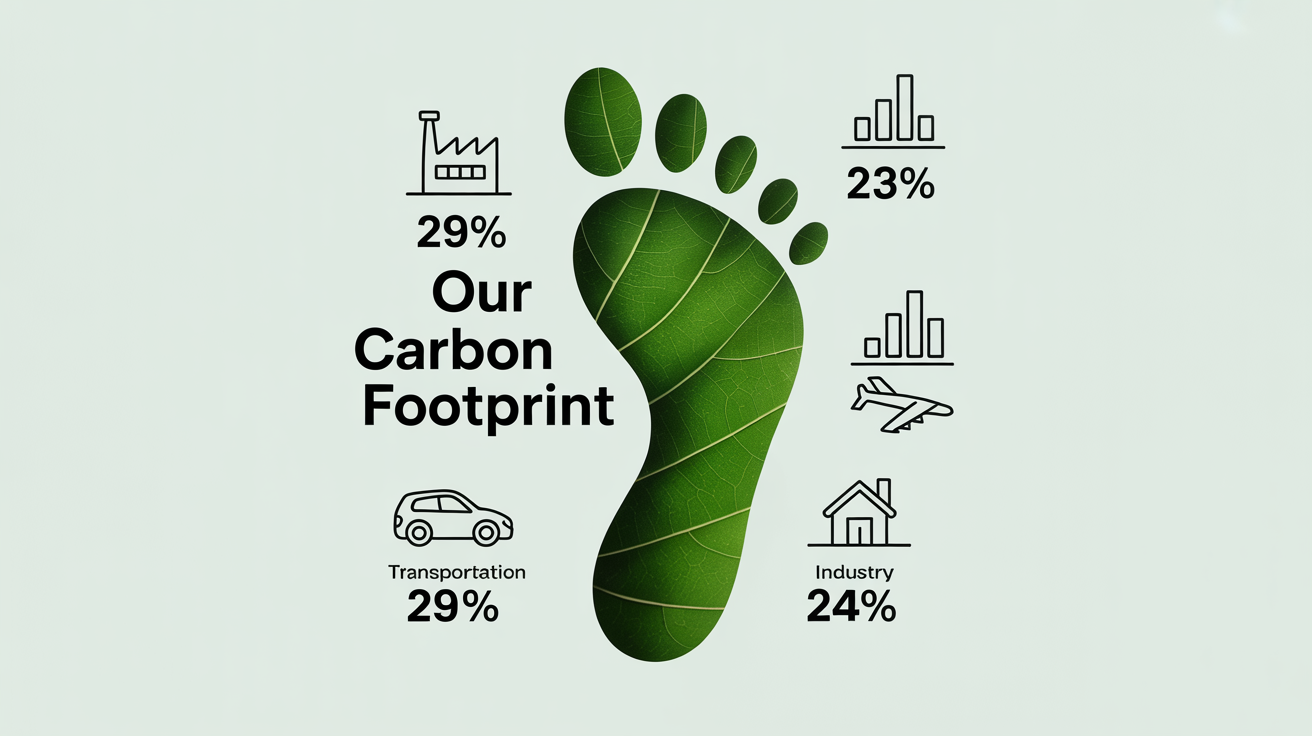
    Click the generate button and our AI will interpret your prompt to design a custom carbon footprint infographic based on your description.

  3. 3

    Download and Share

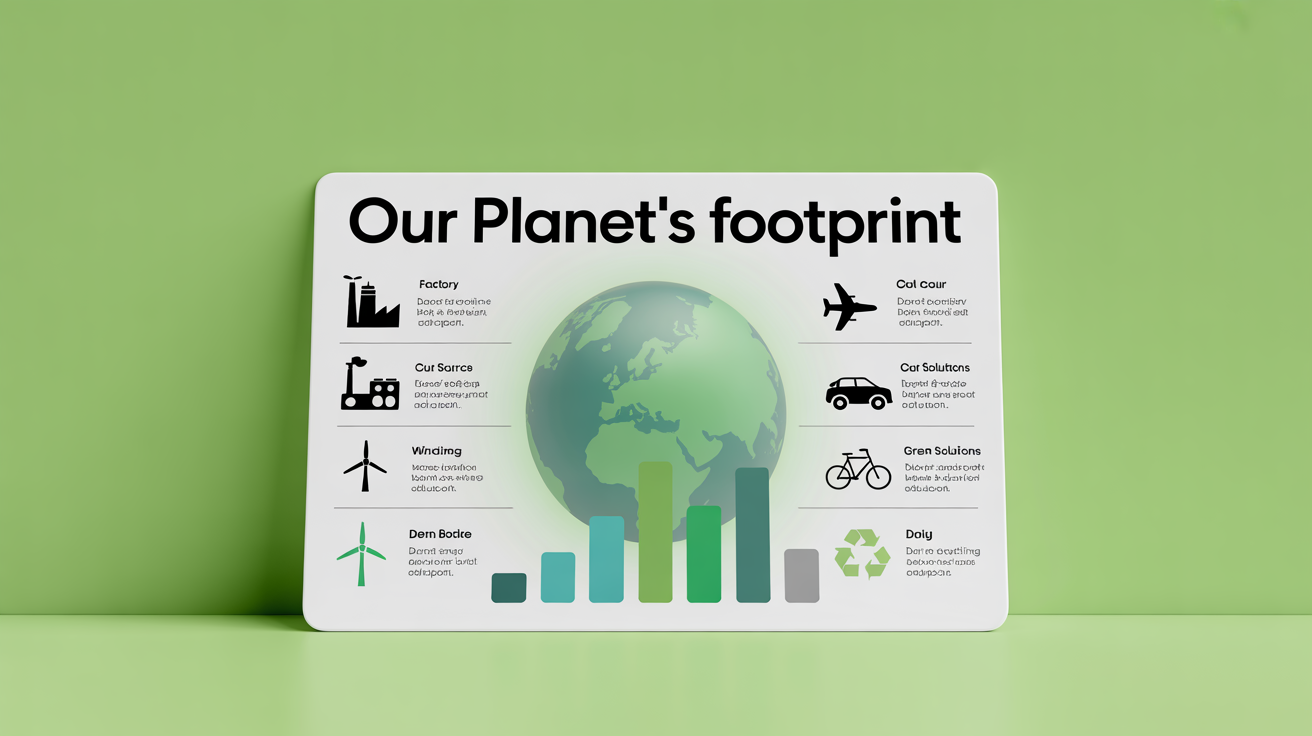
    Your high-resolution infographic is ready to download. Use it to raise awareness in presentations, reports, or on social media.

Turn complex data about emissions and environmental impact into a clear, easy-to-understand infographic. Our AI tool allows you to describe the statistics, facts, and visual elements you want to include, generating a unique design in moments. There's no need to struggle with complicated design software. Whether you're a student, educator, or advocate, you can create professional-quality graphics that explain the importance of reducing our carbon footprint. Communicate your message effectively and inspire action with powerful, data-driven visuals made simple.

Transform Data into Compelling Visuals Instantly

An infographic illustrating the sources of a carbon footprint, showing a large footprint graphic containing icons and percentages for transportation, industry, energy, and agriculture.
Tailor your infographic to focus on any aspect of sustainability. From illustrating the impact of deforestation to showcasing the benefits of renewable energy, you have full creative control. Simply type your desired theme and elements into the prompt. Ask the AI to use specific colors, icons representing transport or energy, and visual styles that match your campaign's tone. This flexibility enables you to produce targeted content for presentations, social media campaigns, or educational materials that resonate with your specific audience.

Customize Your Environmental Message

A modern infographic mockup illustrating progress in carbon footprint reduction. It features a central footprint icon made of leaves, surrounded by data points on industrial emissions, EV adoption, and reforestation, with the title 'Our Planet's Progress'.
Generate high-resolution infographics perfect for raising awareness across any platform. The visuals you create are ideal for sharing on social media, embedding in blogs, or including in school projects and corporate sustainability reports. By making information about carbon footprints accessible and visually engaging, you can help educate a wider audience on climate issues. The generated infographics are downloadable and ready to be used, helping you spread your environmental message without any watermarks or limitations on use.

Create Shareable Graphics for Advocacy and Education

A modern infographic mockup explaining the concept of a carbon footprint. It features clean icons for pollution sources and solutions, alongside charts and the title 'Understanding Your Carbon Footprint' on a white background.
It’s Fast: Go from a simple text description to a completed infographic in seconds. It’s Easy to Use: No design experience needed. If you can describe your idea, you can create a professional infographic. AI-Powered: Leverage artificial intelligence to translate complex data and ideas into clear visuals. Highly Customizable: Specify icons, color schemes, and data points to make the design truly yours. Effective Communication: Use your custom infographics for reports, social media, or classroom materials to effectively communicate your message.

Why use Pixelcut's AI Carbon Footprint Infographic Generator?

A minimalist infographic about carbon footprints. It features a central graphic of a green leaf shaped like a footprint, surrounded by icons and data representing sources of emissions like transportation and industry.
Educational Content: Create materials for classrooms to teach students about environmental science and personal responsibility. Corporate Responsibility Reports: Visualize your company’s sustainability efforts and goals for stakeholders and employees. Social Media Campaigns: Design eye-catching graphics to raise awareness and encourage followers to take climate action. Non-Profit Advocacy: Develop powerful visuals for campaigns aimed at influencing policy and public opinion on environmental issues. Personal Projects: Illustrate your own carbon footprint journey to inspire friends and family.

Carbon Footprint Infographic Use Cases

A modern infographic mockup explaining the carbon footprint, featuring green and teal icons for sources and solutions on a clean white background.

Frequently Asked Questions

Pixelcut is loved by over 2 million people

  • My favorite app

    Great app, easy to use. Helps our small business save time and money to create different marketing materials professionally. Thank you.
    Shaelyn D.
  • Best background remover

    I need a good background remover for my work and I've been through them all it feels like. This one is the best by far. It's so easy to use and the results always look amazing. Thank you Pixelcut!
    Kira H.
  • Love it

    It's amazingly easy and gives the perfect results for my bags and accessories. It looks like it was done by a professional photographer.
    Mary J.