Pixelcut
A professionally designed ecosystem map shown in a 16:9 format. The map uses a blue, green, and teal color scheme and displays interconnected nodes with labels like 'Technology Platforms' and 'Customer Segments' on a light gray background, representing a final infographic design.

AI Ecosystem Map Generator

Trusted by 70 million people
171,800 Reviews
Developer API
Available on iPhone & Android

How to create an ecosystem map

  1. 1

    Describe your ecosystem

    Start by writing a detailed prompt. List the key entities, stakeholders, or components of your system and explain how they are connected to each other.

  2. 2

    Generate your map

    With a single click, our AI will interpret your description and create a clear, organized visual map of your ecosystem.

  3. 3

    Download your map

    Your high-resolution ecosystem map is ready to be downloaded as a PNG file. Use it in your strategic plans, presentations, or team brainstorming sessions.
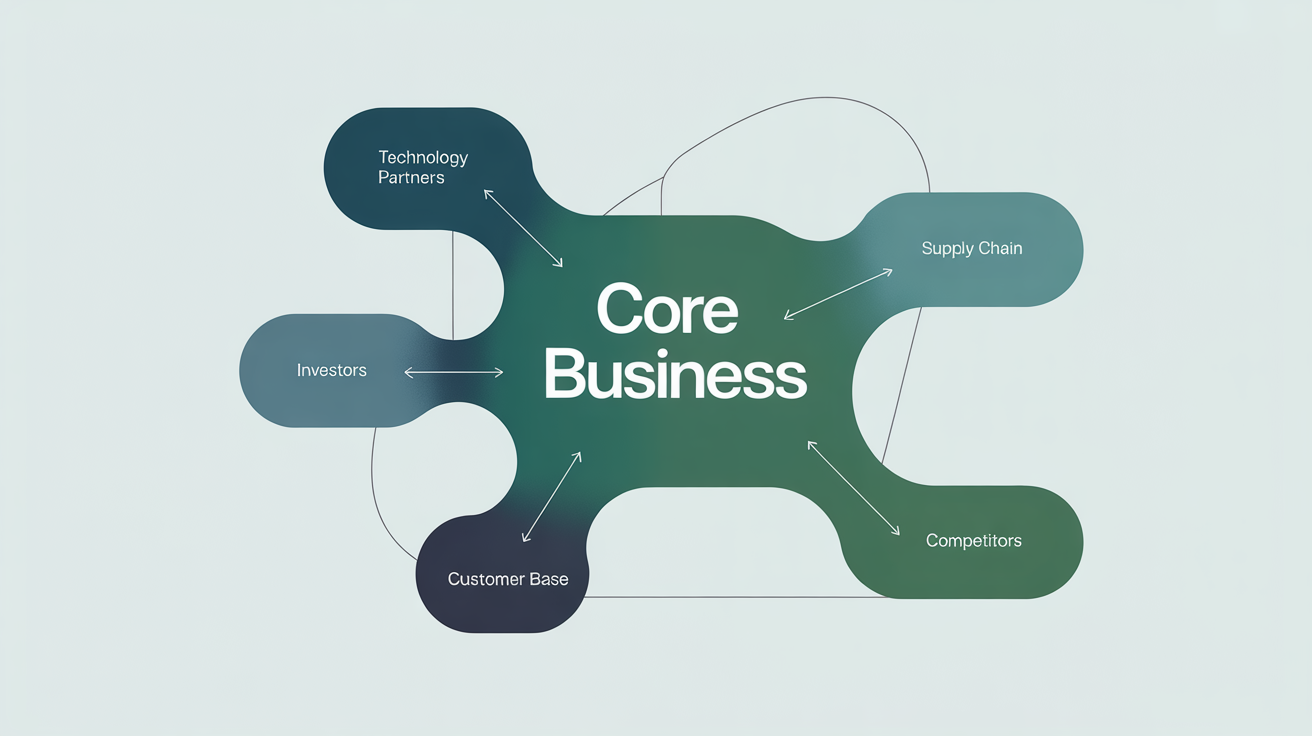
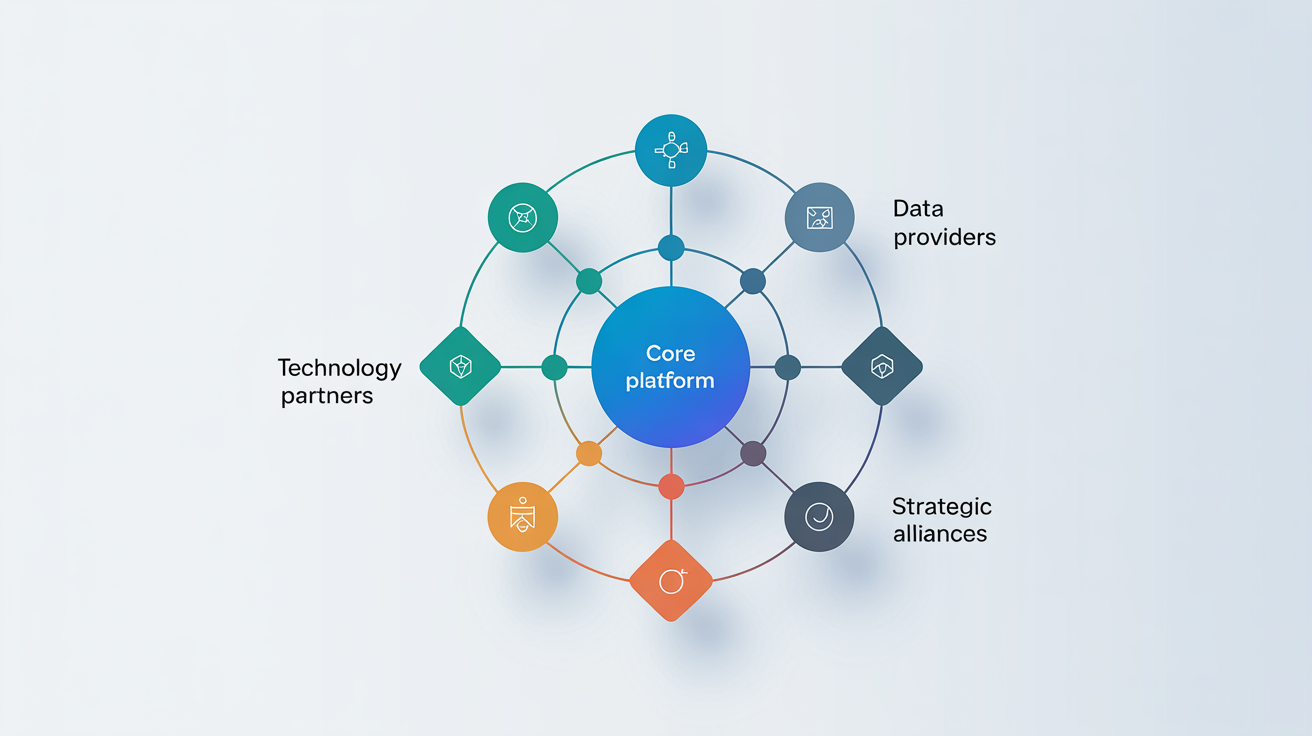
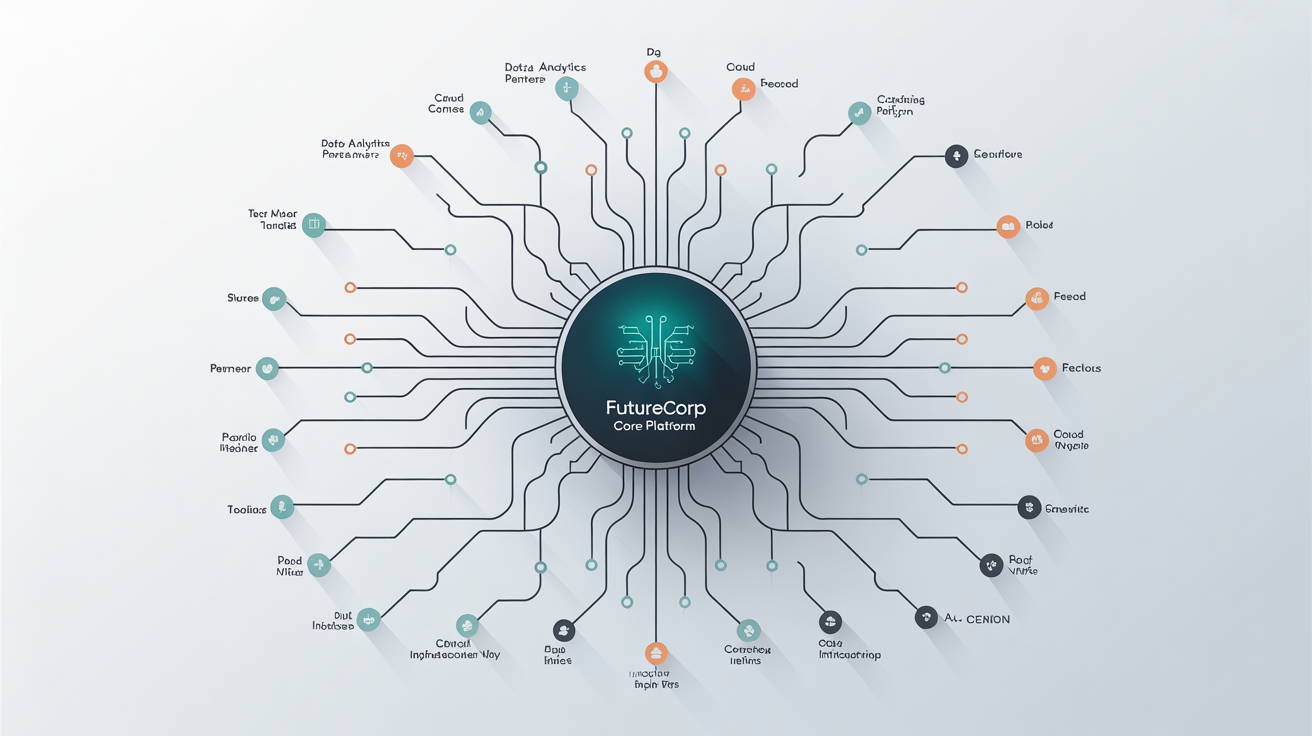
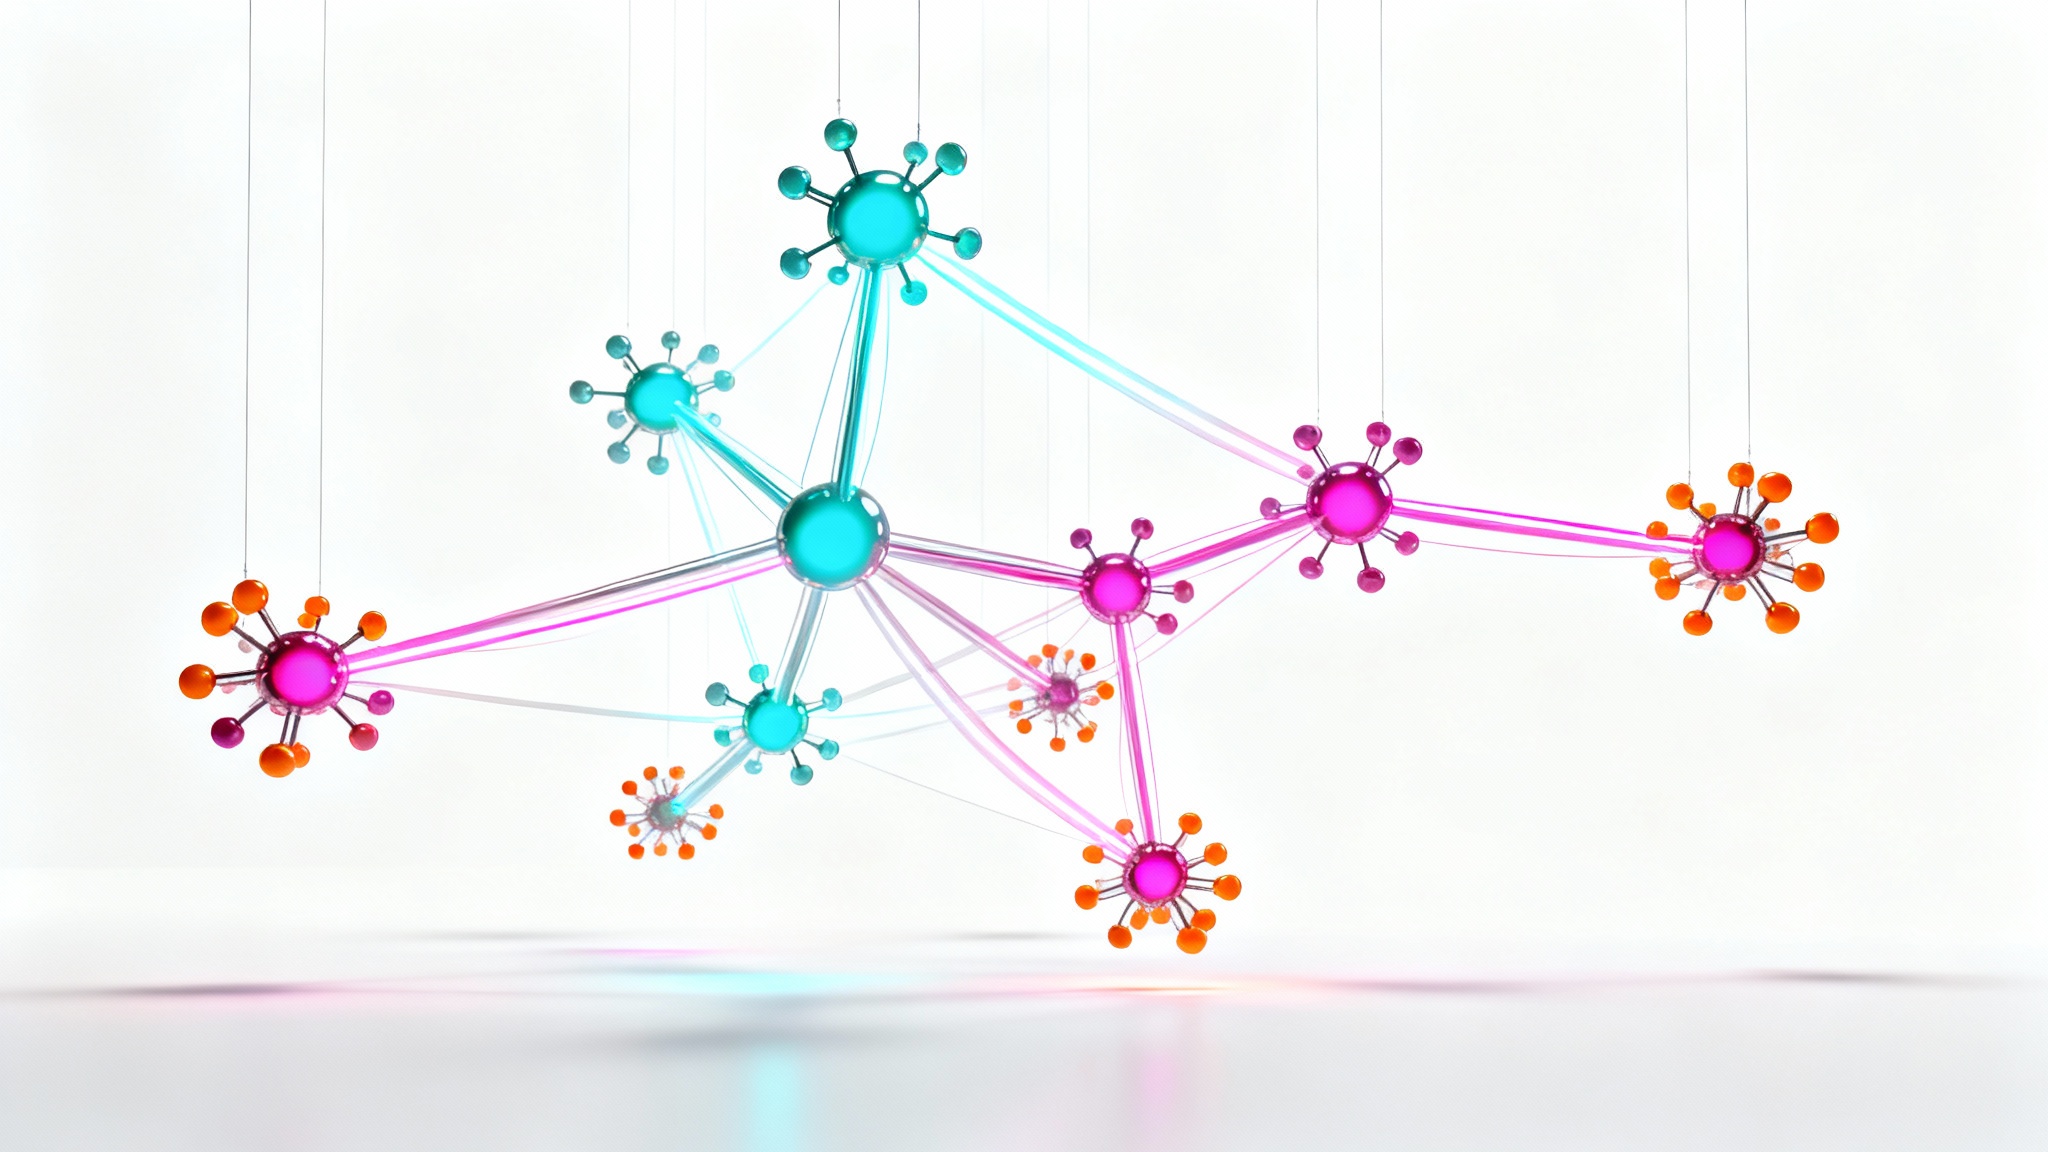
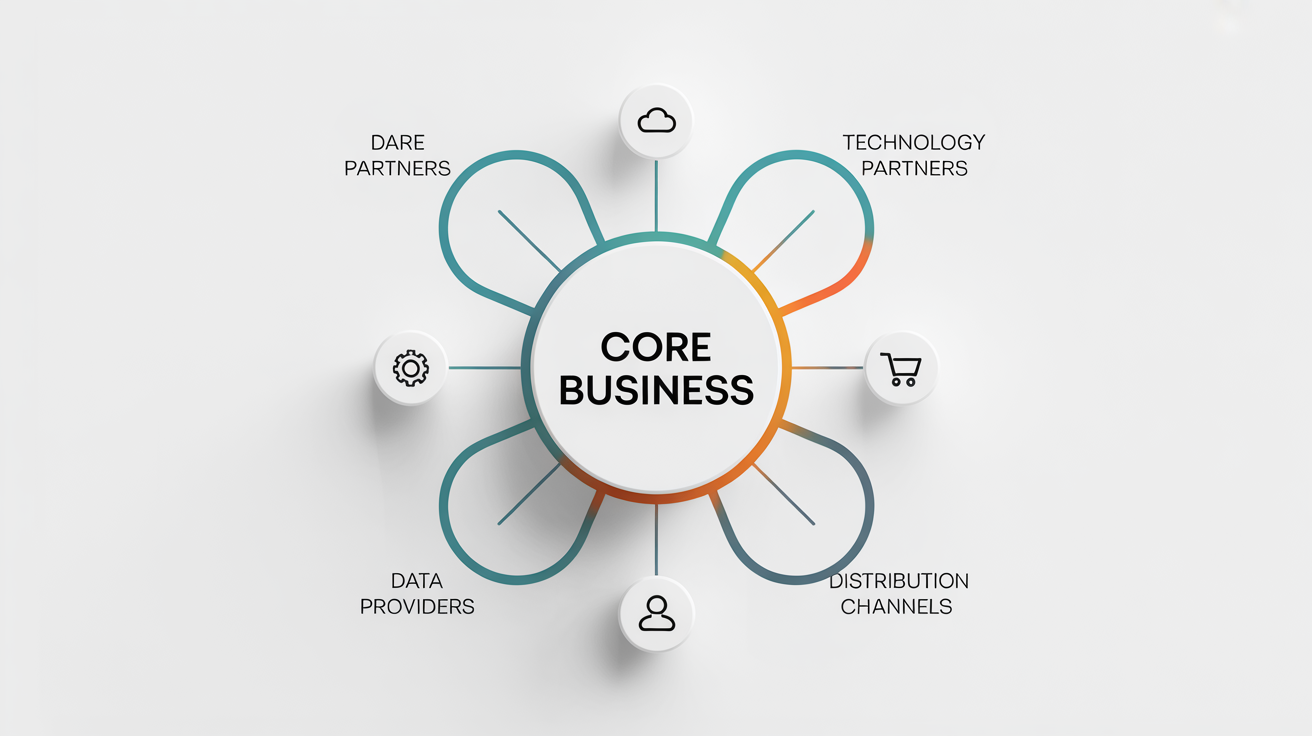
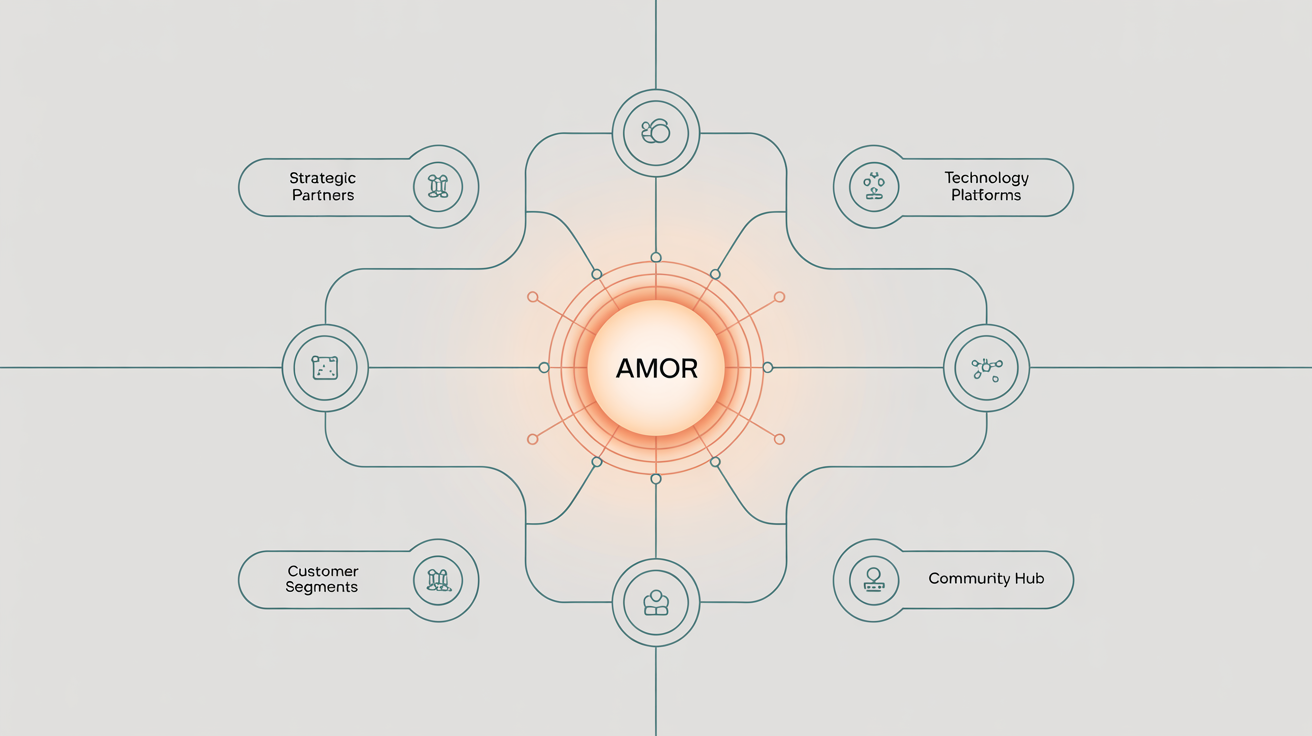
Move past the confusion of manual diagramming tools. Our AI ecosystem map generator transforms your text descriptions into clear, comprehensive visuals in seconds. Describe the actors, relationships, and flows within your business or project environment, and watch as the AI organizes everything into an insightful map. This approach saves valuable time and effort, allowing you to focus on analyzing the strategic insights your new map provides rather than struggling with drawing tools and layouts. It's the fastest way to get a bird's-eye view of your entire system.

Instantly Visualize Complex Systems

A minimalist and professional ecosystem map diagram showing a central 'Core Business' node connected to various other nodes like partners, customers, and investors.
Whether you are charting a tech startup's partner network, a non-profit's community stakeholders, or a product's supply chain, our tool adapts to your needs. Create detailed maps by specifying every component, from direct suppliers and customers to regulatory bodies and market influencers. Describe the nature of the connections, such as data exchange, financial investment, or service delivery. This flexibility ensures you can produce a tailored, relevant diagram that accurately reflects the unique structure and dynamics of your specific field.

Custom Maps for Any System or Industry

A modern infographic of a business ecosystem map on a white background, showing a central 'Core Platform' node connected to other nodes like 'Technology Partners' and 'Customer Segments' via a network of lines.
Our AI doesn't just place elements on a page; it intelligently designs a map that is both logical and easy to interpret. By analyzing your prompt, it arranges nodes and pathways to highlight key relationships and minimize visual clutter. The resulting map uses a clean aesthetic with distinct icons and clear connectors to help you and your stakeholders quickly understand system dependencies, identify opportunities, and spot potential risks. This makes your ecosystem map a powerful tool for communication and strategic planning.

Clarity Through Intelligent Design

An infographic of a business ecosystem map on a white background. A central hub labeled 'FutureCorp Core Platform' connects to various nodes representing partners, customers, and infrastructure, illustrating a complex network.
It’s Fast: Go from a complex idea to a complete visual map in just a few moments. It’s AI-Powered: Let artificial intelligence handle the difficult work of layout and design so you can focus on the insights. Easy to Use: If you can describe your system in words, you can create a professional ecosystem map. No design skills are necessary. Highly Customizable: Tailor every detail by describing the specific entities and interactions of your unique environment. Presentation-Ready: Download high-resolution maps that are perfect for reports, presentations, and workshops.

Why use Pixelcut's AI Ecosystem Map Generator?

An abstract 3D visualization of an ecosystem map, featuring a network of glowing, colorful spheres connected by luminous lines against a plain white background.
Business Strategy: Map out your market landscape, including competitors, partners, and customer segments, to find strategic advantages. Stakeholder Analysis: Visualize the network of individuals and organizations connected to your project to better understand their influence and relationships. Product Development: Chart all the internal and external dependencies for a new product to ensure a smooth launch. IT and Systems Architecture: Create diagrams of your technology infrastructure, showing how different platforms and services connect and interact.

Ecosystem Map Generator Use Cases

A modern vector diagram of a business ecosystem map on a white background. A central node labeled 'Core Business' is connected by colored lines to smaller nodes representing partners, data providers, and users.

Frequently Asked Questions

Pixelcut is loved by over 2 million people

  • My favorite app

    Great app, easy to use. Helps our small business save time and money to create different marketing materials professionally. Thank you.
    Shaelyn D.
  • Best background remover

    I need a good background remover for my work and I've been through them all it feels like. This one is the best by far. It's so easy to use and the results always look amazing. Thank you Pixelcut!
    Kira H.
  • Love it

    It's amazingly easy and gives the perfect results for my bags and accessories. It looks like it was done by a professional photographer.
    Mary J.