Pixelcut
A close-up of a modern computer screen displaying a professionally designed Gantt chart with colorful task bars, project timelines, and clear labels, representing a final project plan.

AI Gantt Chart Image Generator

Trusted by 70 million people
171,800 Reviews
Developer API
Available on iPhone & Android

How to create a Gantt chart

  1. 1

    Describe your project plan

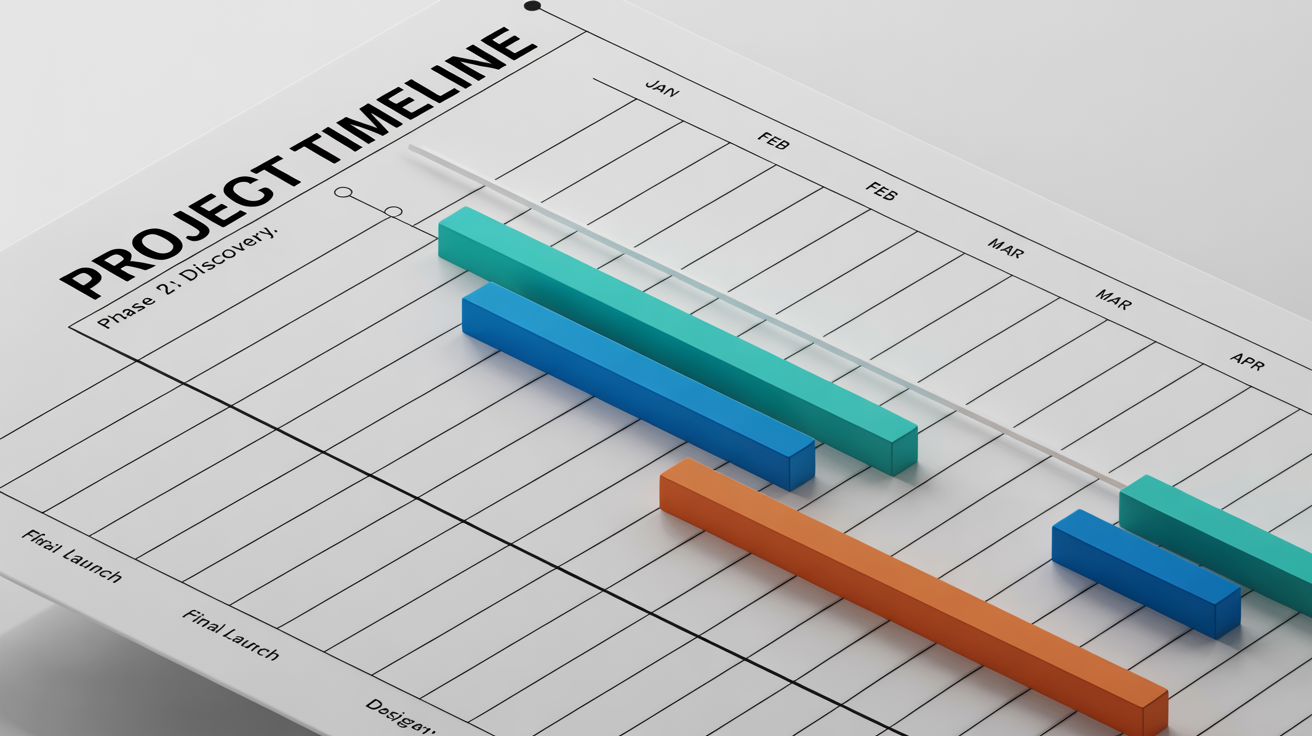
    Start by typing a detailed description of your project. Include the main phases, tasks, and estimated timelines. The more detail you provide, the better the chart will be.

  2. 2

    Generate your Gantt chart

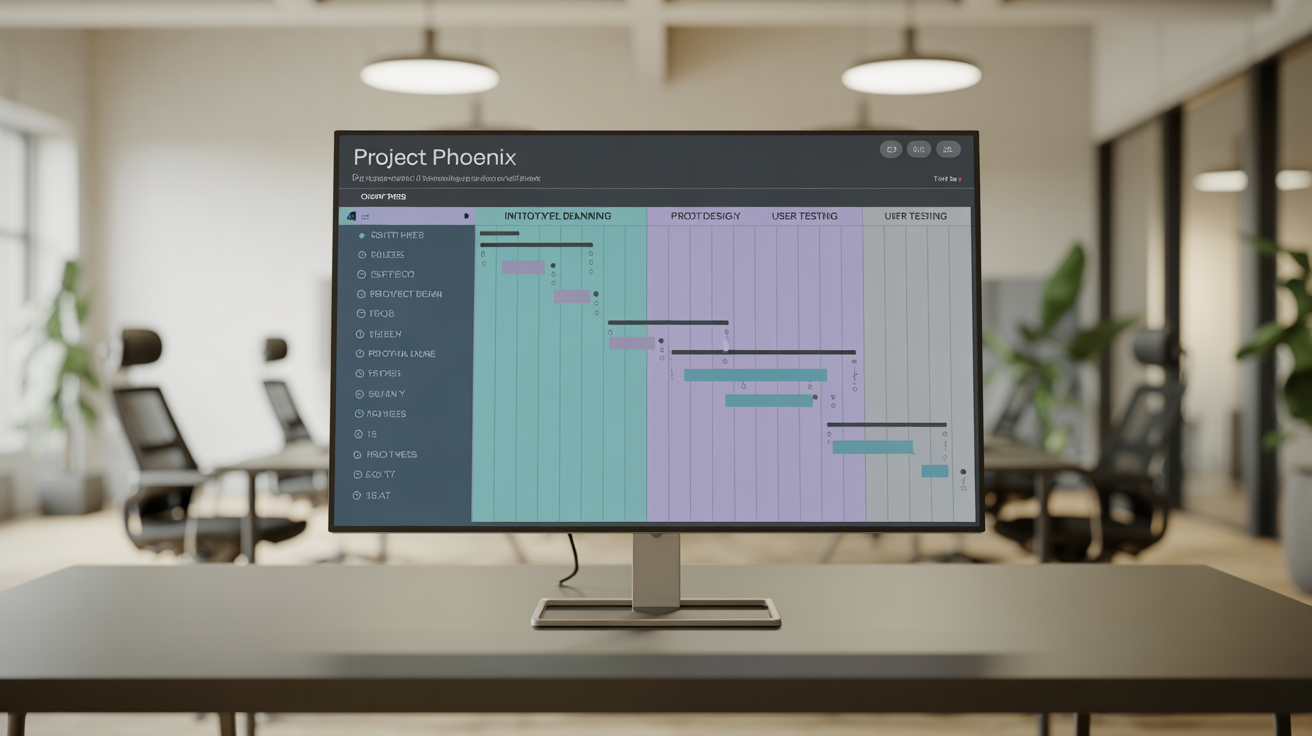
    Click the generate button to let the AI process your prompt. In just a few moments, it will create a visual Gantt chart that organizes your project schedule.

  3. 3

    Download your chart

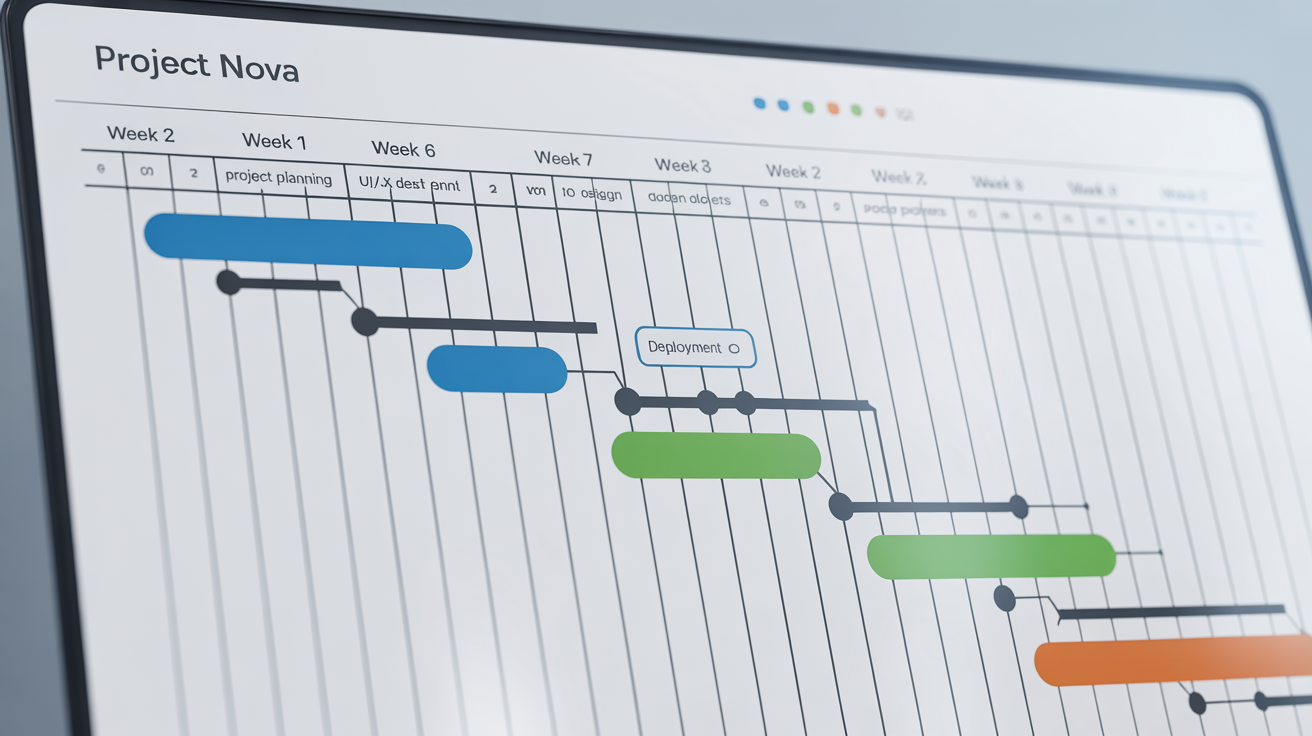
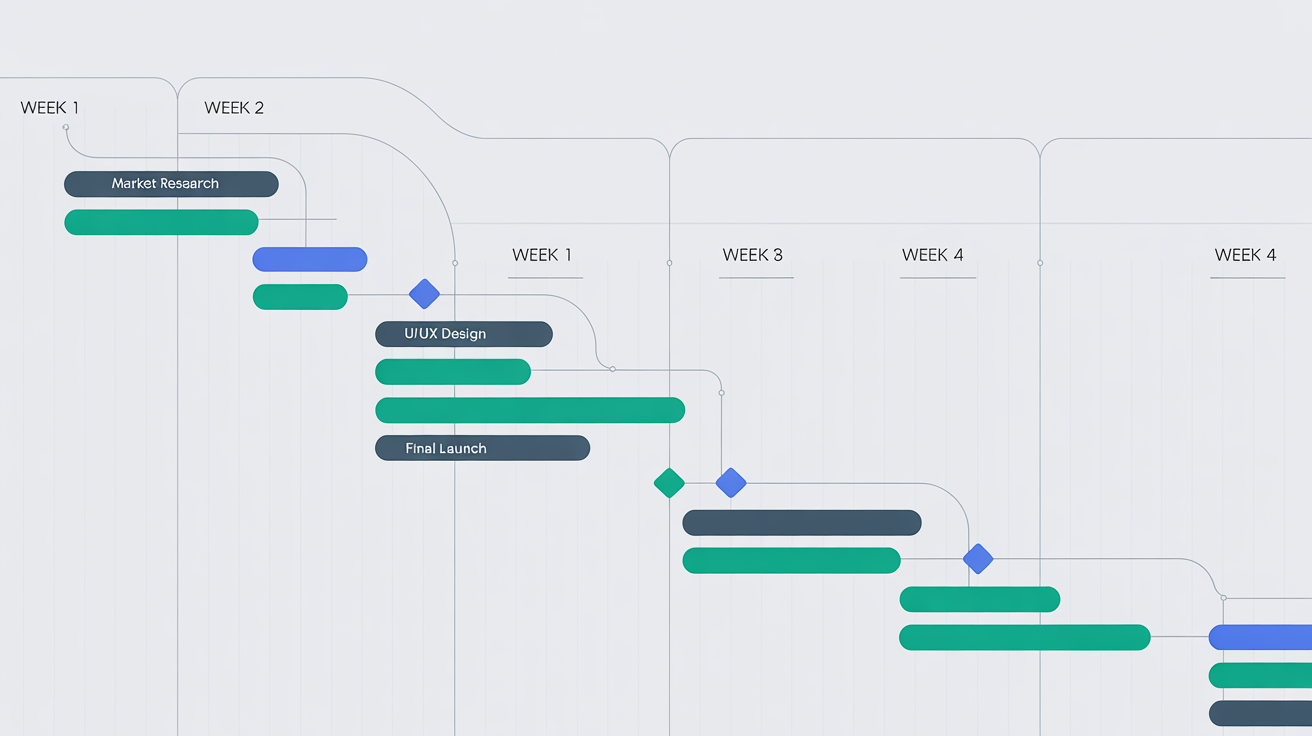
    Your Gantt chart is ready to be downloaded as a high-resolution, watermark-free PNG. Share it with your team, add it to a presentation, or use it to keep your project on track.
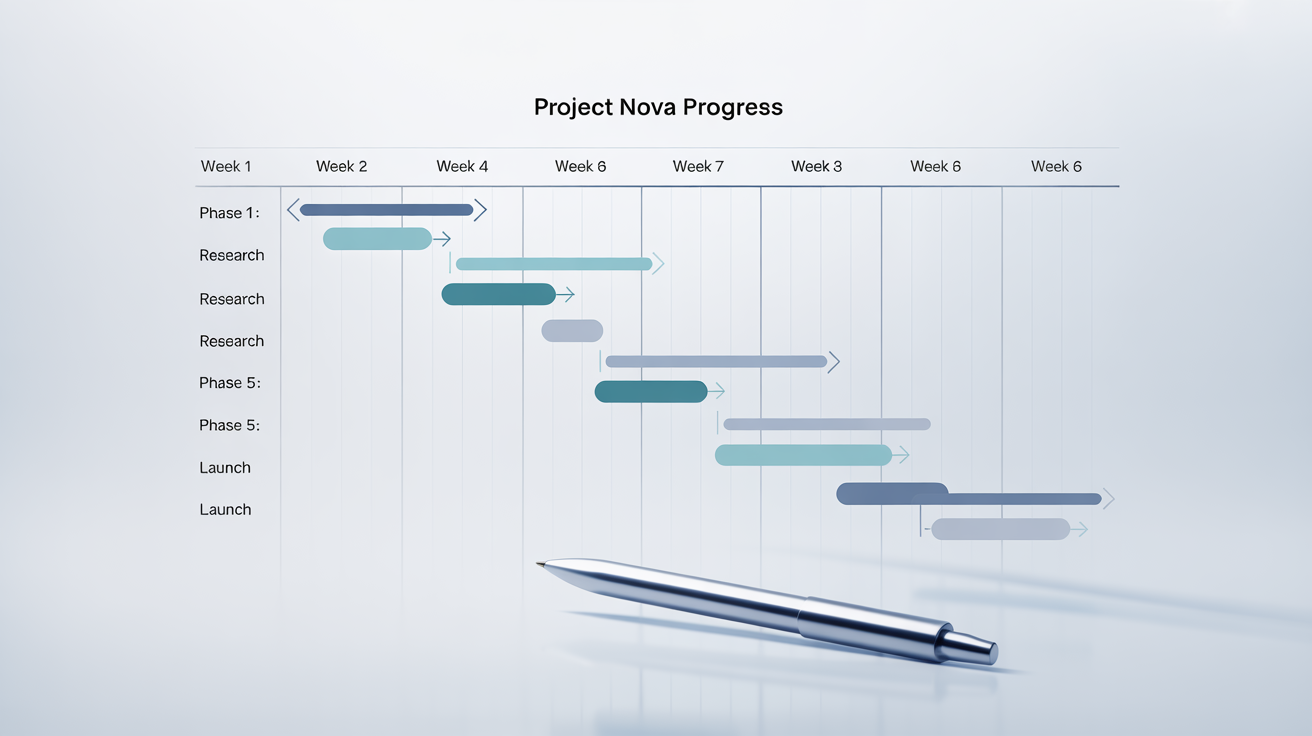
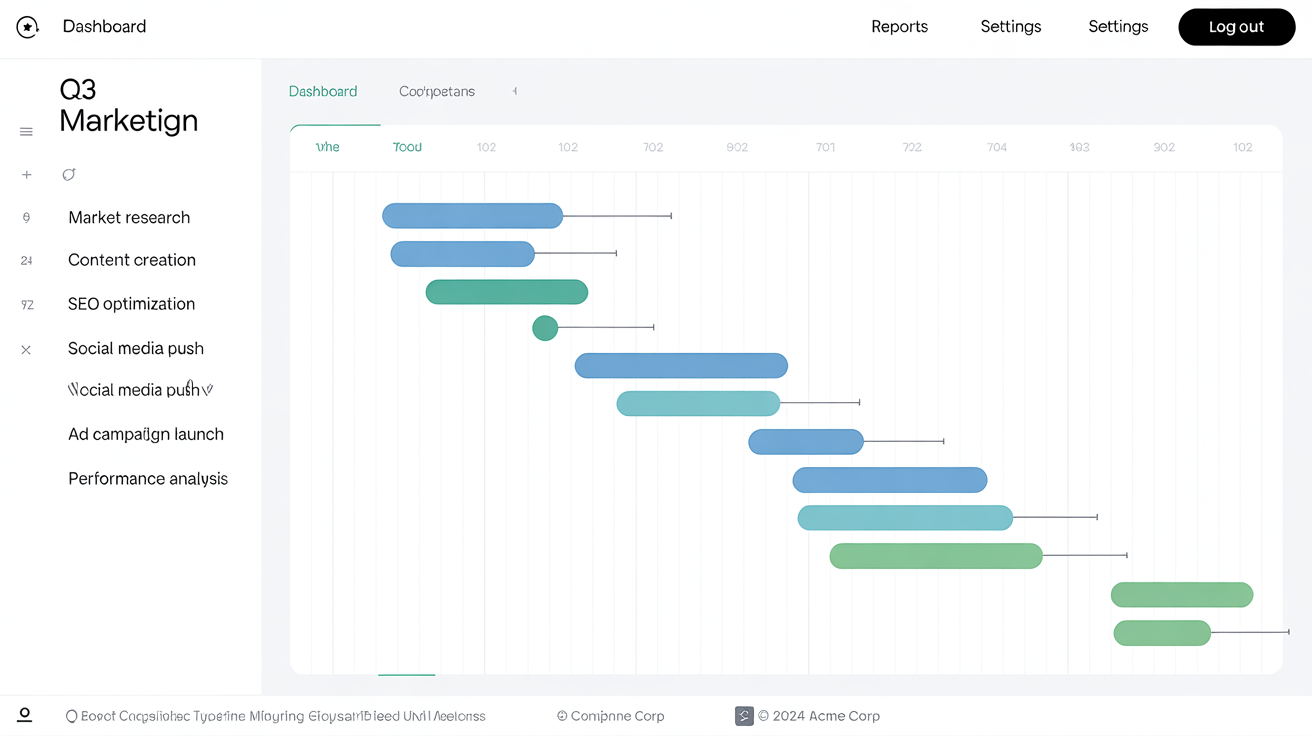
Go from a simple project description to a comprehensive visual timeline in moments. Our AI Gantt chart generator interprets your text to map out every task, phase, and milestone. There is no need for complicated spreadsheet formulas or manual bar adjustments. Just type out your plan, and the AI builds a professional-looking Gantt chart that clearly displays your project's entire lifecycle. This immediate visualization helps you spot overlaps, manage resources, and set realistic deadlines from the very beginning.

Instant Project Visualization

A 3D mockup of a modern Gantt chart showing a project schedule with colorful bars and task labels against a clean white background.
Forget the steep learning curve of traditional project management software. With our tool, if you can describe your project, you can create a Gantt chart. Simply outline your goals, tasks, and timelines in plain language. The AI handles the complex part, structuring your input into an organized chart that is easy to read and understand. This makes project planning accessible to everyone, not just seasoned project managers. Plan marketing campaigns, events, or development sprints without any specialized training.

Simplify Your Project Planning

A clean and modern Gantt chart demonstrating a project timeline, with tasks like 'Research', 'Design', and 'Development' plotted over several weeks.
A clear plan keeps everyone on the same page. Generate a Gantt chart and share a high-resolution visual of the project roadmap with your team and stakeholders. The chart provides a single source of truth for deadlines, dependencies, and responsibilities, which reduces confusion and aligns everyone's efforts. By presenting the project schedule in a simple visual format, you can facilitate better communication and ensure that every team member understands their role in the bigger picture, fostering a more coordinated workflow.

Streamline Team Collaboration

A modern and colorful Gantt chart mockup displaying project timelines and tasks for 'Project Nova' on a clean white background.
It's Fast: Create a full project timeline from a text prompt in seconds. It’s Simple: No need for project management expertise; just describe your plan. AI-Powered: Leverage artificial intelligence to automatically structure tasks and timelines. Visually Clear: Get a clean, easy-to-read chart that clarifies complex schedules. Versatile: Perfect for any project, from business launches to academic assignments. You can easily generate a chart that is ready for presentations, reports, or team meetings.

Why use Pixelcut's AI Gantt Chart Generator?

A modern Gantt chart mockup for a 'Q3 Marketing Campaign', showing project tasks like 'Market Research' and 'Content Creation' with a colorful timeline on a white background.
Marketing Campaigns: Map out every step from content creation to ad launch to track progress toward campaign goals. Software Development: Plan development sprints, feature releases, and testing phases with clear timelines. Event Planning: Coordinate everything from venue booking to day-of logistics to ensure your event runs smoothly. Construction Projects: Schedule phases, track contractor timelines, and manage dependencies from foundation to finish. Academic Research: Outline research tasks, writing periods, and submission deadlines for a thesis or dissertation.

Gantt Chart Generator Use Cases

A modern, colorful Gantt chart on a white background, illustrating a project timeline with various tasks and milestones.

Frequently Asked Questions

Pixelcut is loved by over 2 million people

  • My favorite app

    Great app, easy to use. Helps our small business save time and money to create different marketing materials professionally. Thank you.
    Shaelyn D.
  • Best background remover

    I need a good background remover for my work and I've been through them all it feels like. This one is the best by far. It's so easy to use and the results always look amazing. Thank you Pixelcut!
    Kira H.
  • Love it

    It's amazingly easy and gives the perfect results for my bags and accessories. It looks like it was done by a professional photographer.
    Mary J.