Pixelcut
A professional architectural visualization displaying three semi-transparent modern house designs on an empty lot, flanked by traditional brick houses, demonstrating design variance options.

Visualize Architectural Variances with AI

Trusted by 70 million people
171,800 Reviews
Developer API
Available on iPhone & Android

How to Create a Variance Visualization

  1. 1

    Upload your site image

    Start by uploading a clear, straight-on photo of the property, lot, or building you want to modify.

  2. 2

    Describe your proposed design

    In the text box, describe the architectural changes or the new building you envision. Include details like style, materials, and colors.

  3. 3

    Generate your visualization

    Click the generate button and let the AI create a photorealistic rendering of your design in its intended environment.

  4. 4

    Download your design

    Your high-resolution variance visualization is ready to be downloaded in PNG format and used in your presentations, applications, or project plans.
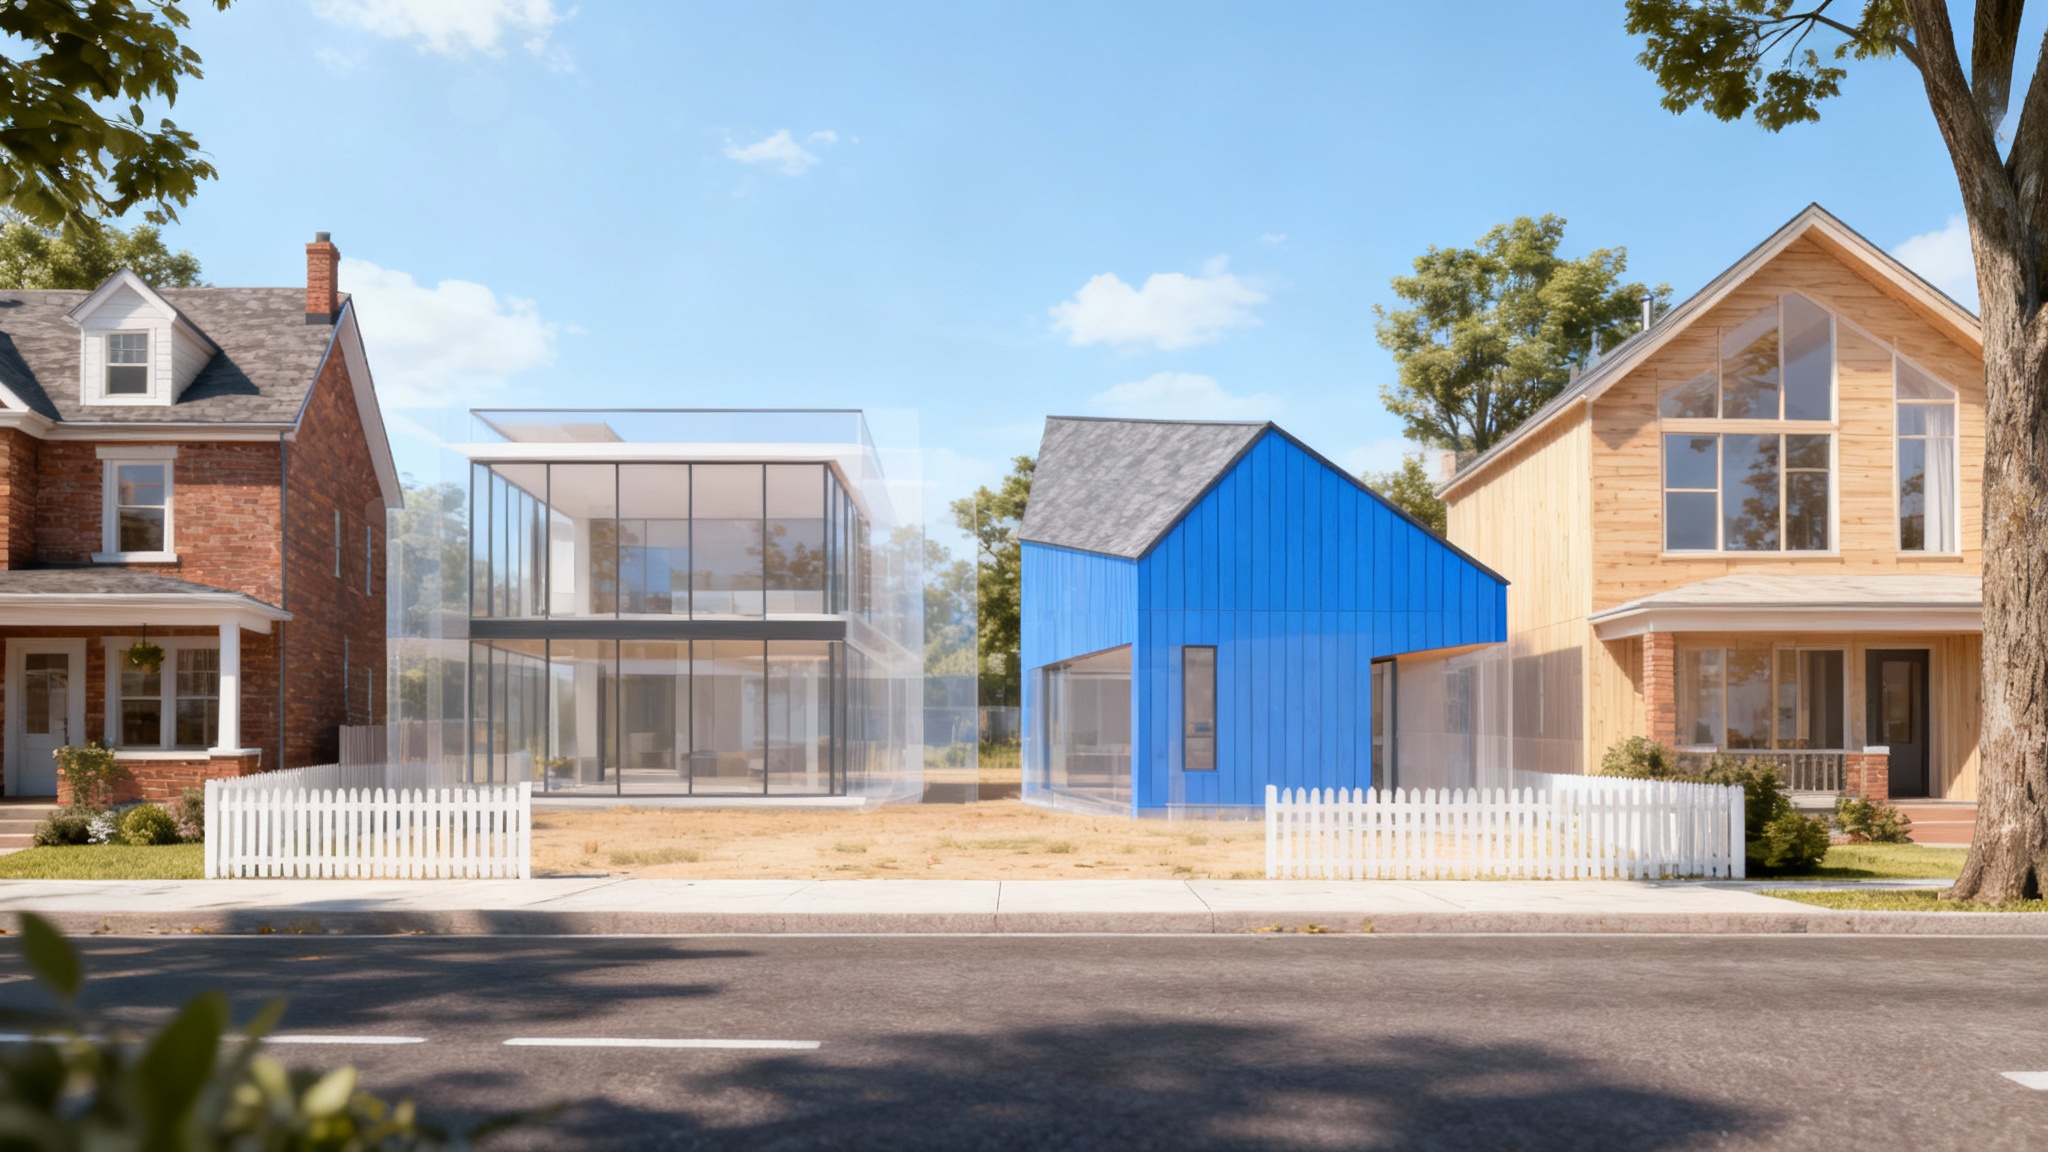
Stop imagining and start seeing. Our AI tool allows you to place your architectural designs directly into a photograph of the actual site. This provides an accurate preview of how the new structure will interact with neighboring buildings, landscaping, and the overall streetscape. Assess visual impact, material harmony, and scale with unparalleled clarity. This contextual rendering is a powerful way for architects, developers, and homeowners to make informed decisions and present proposals that leave nothing to the imagination.

See Designs in Their Real-World Context

A conceptual image illustrating variance, showing a row of five tulips against a white background. Four tulips are identical and red, while the middle one is yellow and slightly different, representing an outlier.
Traditional architectural rendering is often slow and expensive, creating bottlenecks in your project timeline. With our AI variance visualization tool, you can generate compelling visuals in seconds. Instantly create variations to explore different materials, colors, or structural changes with a simple text prompt. This rapid iteration capability speeds up client feedback loops and helps you prepare convincing materials for zoning boards and community meetings, making the approval process smoother and faster.

Streamline Your Design and Approval Process

An abstract 3D visualization of statistical variance, showing a central blue line with many glowing spheres scattered around it. Spheres far from the line are colored orange and red, representing high variance.
A picture is worth a thousand words, especially in architecture. Bridge the gap between technical blueprints and your client's or stakeholder's understanding. Provide a photorealistic view of the final project that everyone can appreciate. Whether you are proposing a modern home in a traditional neighborhood or a new commercial facade, our tool helps you communicate your design intent clearly and effectively, fostering better collaboration and gaining buy-in from all parties involved.

Communicate Your Vision with Clarity

A conceptual 3D render illustrating variance, featuring a perfect gray sphere in the center surrounded by other spheres of various sizes and shades of gray, all on a white background.
It’s Contextual: See how your project looks on the actual site. It’s Fast: Generate design variations in seconds, not days. It’s Persuasive: Create compelling, realistic visuals for presentations to clients and zoning boards. It’s Easy to Use: No complex 3D modeling software needed. Just upload a photo and type a description. It’s Iterative: Effortlessly test different styles, materials, and architectural features to find the perfect fit for the environment.

Why use Pixelcut's AI Variance Visualization?

An abstract visualization of variance, showing a line of five glass spheres on a white background. The first is perfect, while the others progressively show more distortion in shape, color, and clarity.
Zoning & Permitting Proposals: Create clear, visual evidence to support your application for a zoning variance. Architectural Client Presentations: Show clients exactly what their future home or building will look like in its surroundings. Real Estate Development: Visualize potential projects on a plot of land to attract investors and market the property. Homeowner Renovation Planning: See how an extension, a new story, or a facade remodel will look on your own house before committing to construction. Urban Planning: Assess the impact of new developments on the existing urban fabric.

Variance Visualization Use Cases

An abstract visualization of data variance, showing a perfect central line next to a series of varied lines that differ in height and angle, all on a clean white background.

Frequently Asked Questions

Pixelcut is loved by over 2 million people

  • My favorite app

    Great app, easy to use. Helps our small business save time and money to create different marketing materials professionally. Thank you.
    Shaelyn D.
  • Best background remover

    I need a good background remover for my work and I've been through them all it feels like. This one is the best by far. It's so easy to use and the results always look amazing. Thank you Pixelcut!
    Kira H.
  • Love it

    It's amazingly easy and gives the perfect results for my bags and accessories. It looks like it was done by a professional photographer.
    Mary J.