My favorite app
Great app, easy to use. Helps our small business save time and money to create different marketing materials professionally. Thank you.

Write a prompt detailing your case study. Include the client, challenge, solution, and key metrics. Specify your desired colors and style.
Our AI will analyze your prompt and create a unique case study graphic, organizing your information into a clean, professional layout with charts and icons.
Your high-resolution case study graphic is ready to be downloaded as a PNG. Use it in presentations, on your website, or in marketing materials.

An AI case study graphic designer is a tool that uses artificial intelligence to automatically create visual designs for case studies based on text descriptions. You provide the key information, like the problem, solution, and results, and the AI generates a professional graphic with charts and icons to present your story.
Simply type a prompt describing the case study's content and desired style. Include key data points, color preferences, and any specific icons you want. The AI will then generate a complete graphic that you can download.
For the best results, be specific. Include the client's industry, the main challenge, the solution you provided, and quantifiable results like percentages or revenue figures. For example: 'A case study graphic for a fitness app showing a 30% increase in user retention after implementing a new feature.'
Yes, you can guide the AI to use your brand's identity. Mention your brand colors in the prompt and upload your logo to have it incorporated into the final design for a consistent and professional look.
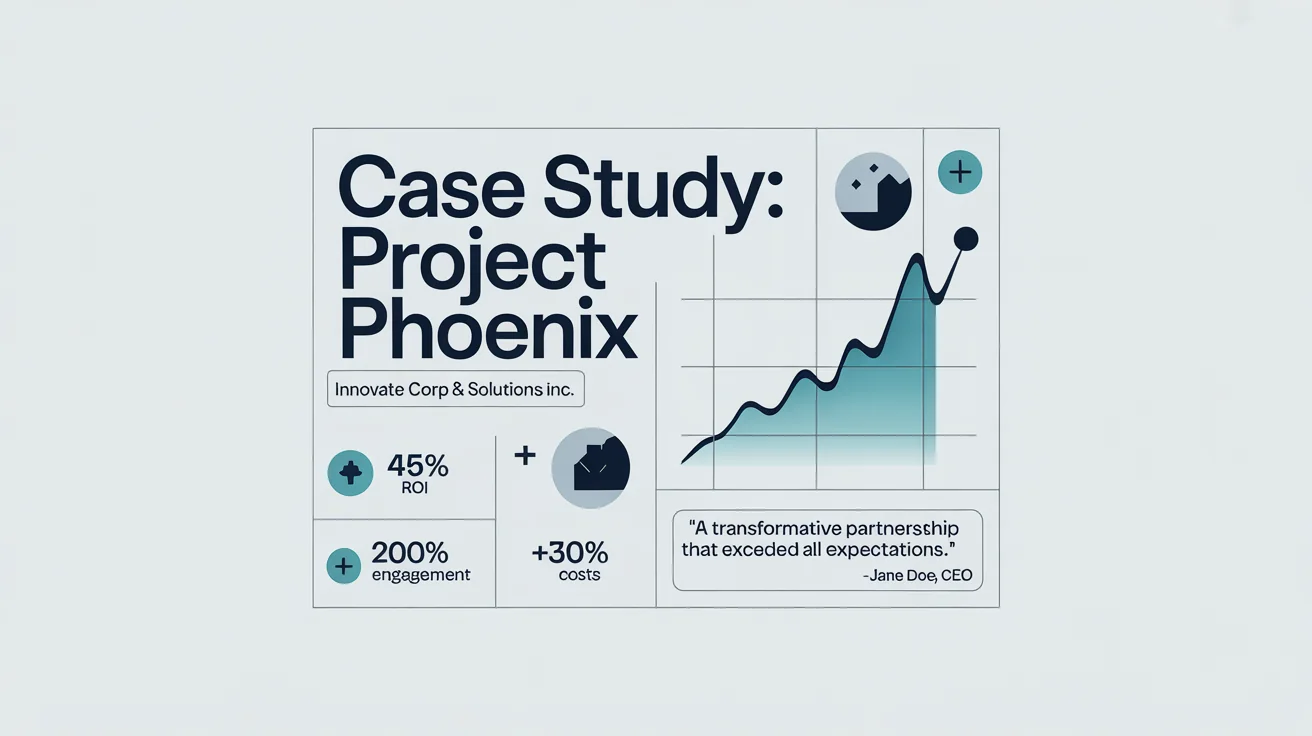
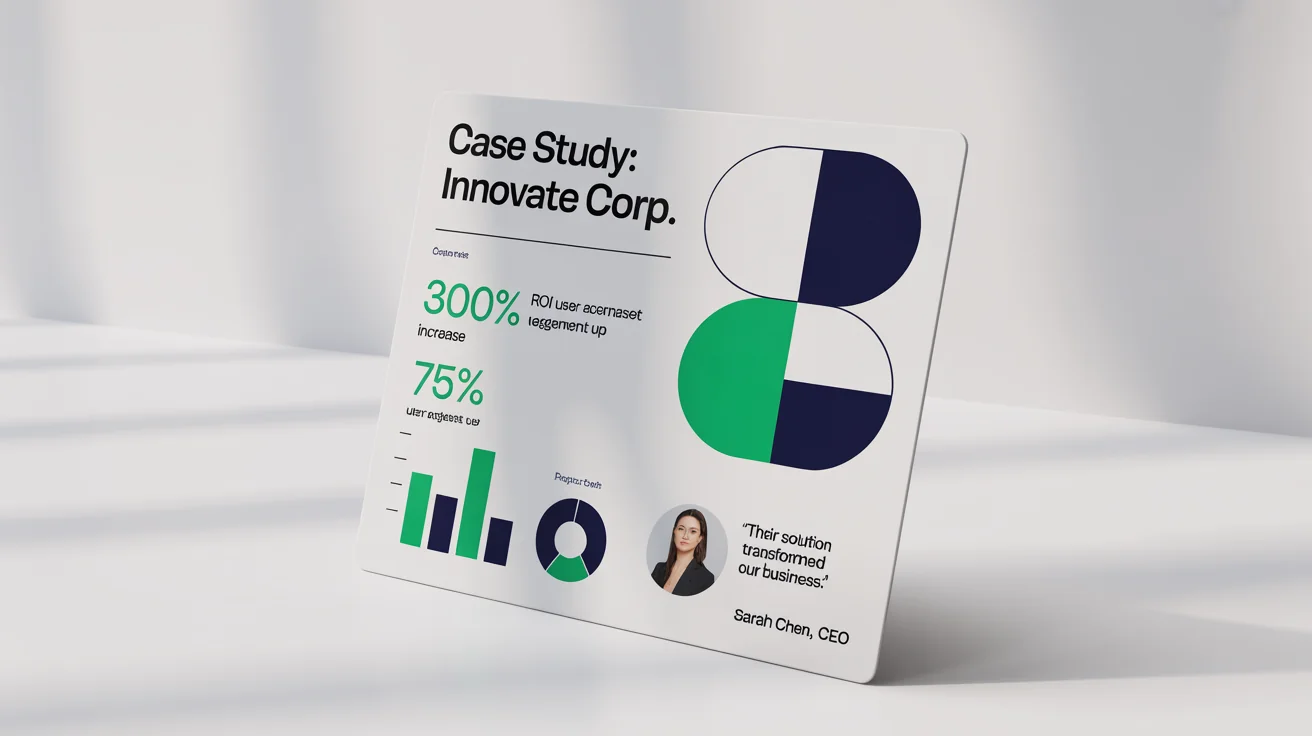
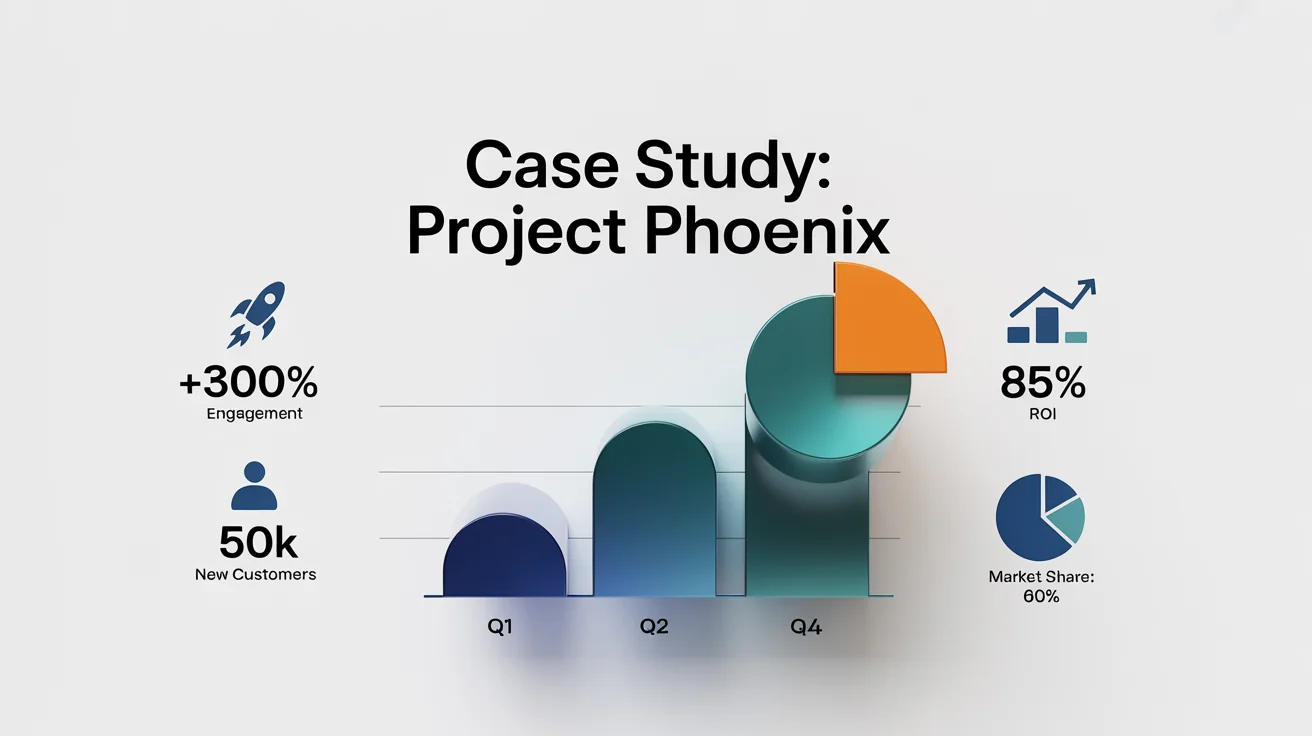
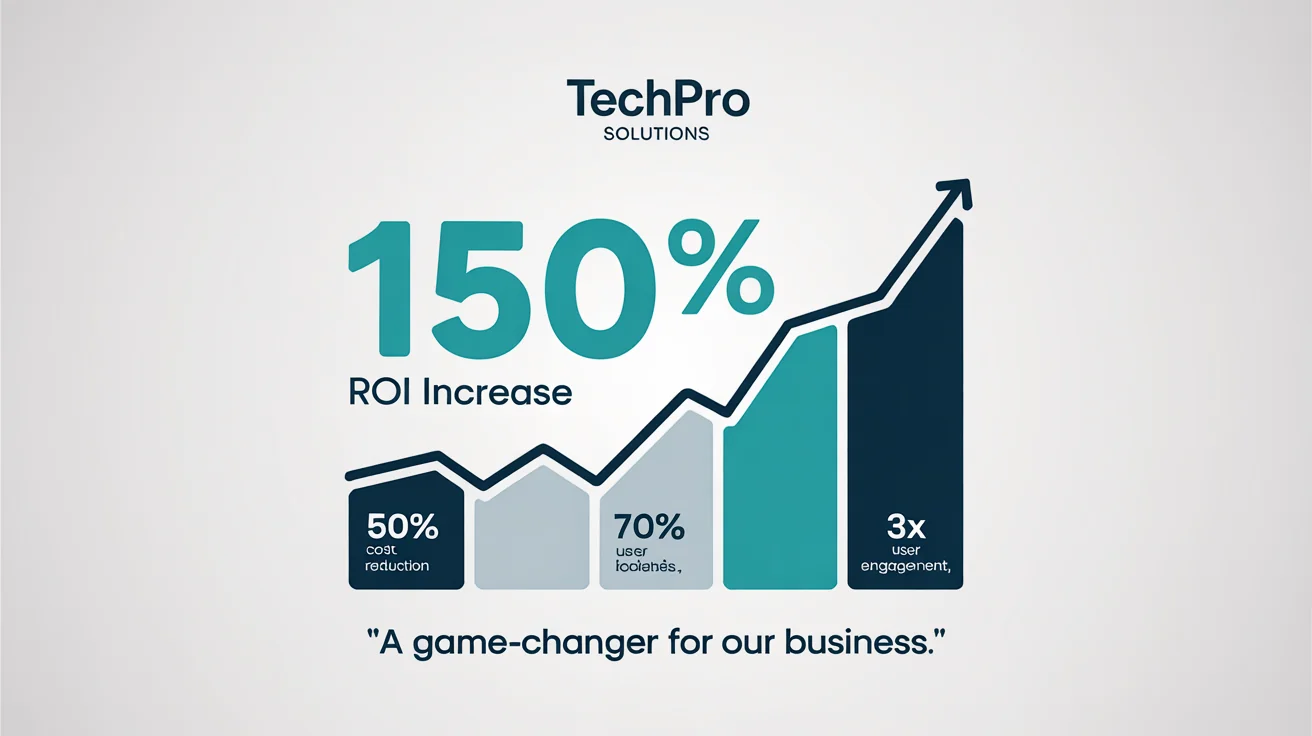
You can visualize a wide range of data. The tool is great for creating bar charts for growth metrics, pie charts for market share, timelines for project progression, and using icons to highlight key stats and achievements.
Absolutely. It's designed for marketers, sales professionals, and anyone who needs to create a professional case study without any graphic design experience. The AI handles all the design work for you.
Great app, easy to use. Helps our small business save time and money to create different marketing materials professionally. Thank you.
I need a good background remover for my work and I've been through them all it feels like. This one is the best by far. It's so easy to use and the results always look amazing. Thank you Pixelcut!
It's amazingly easy and gives the perfect results for my bags and accessories. It looks like it was done by a professional photographer.