Free AI Image Generator
Explore the possibilities
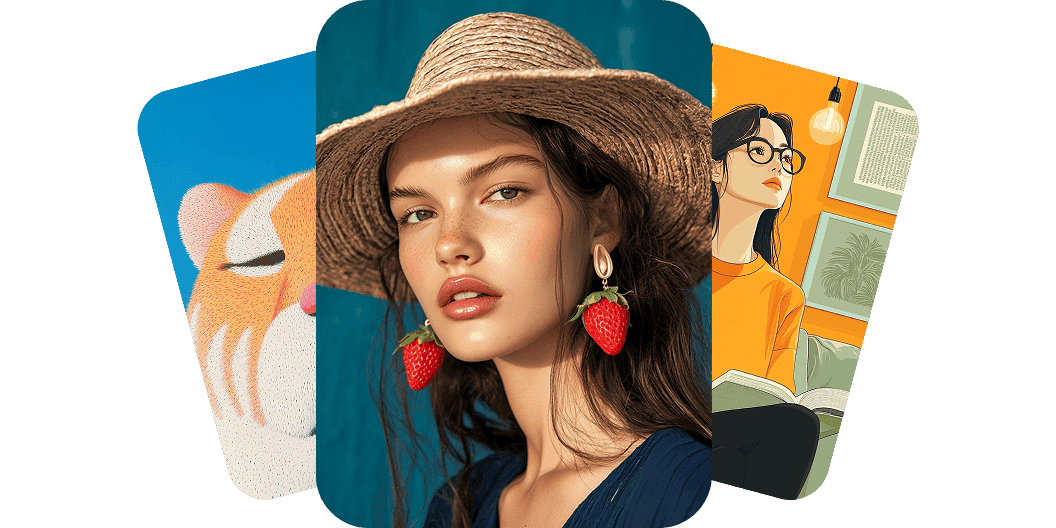
Bring your imagination to life with our AI Image Generator
Bring your imagination to life using Pixelcut’s AI Image Generator. Instantly create high-quality images for any need using simple text prompts. Whether you’re a content creator looking to create a post for social media, an entrepreneur looking for unique visual assets to use in your marketing collateral, a designer looking for inspiration, or just someone looking to experiment, our free image generator is the perfect solution. Save time and create stunning visuals effortlessly with Pixelcut's AI Image Generator. Explore your creativity and try it now!
Bring your imagination to life with our AI Image Generator
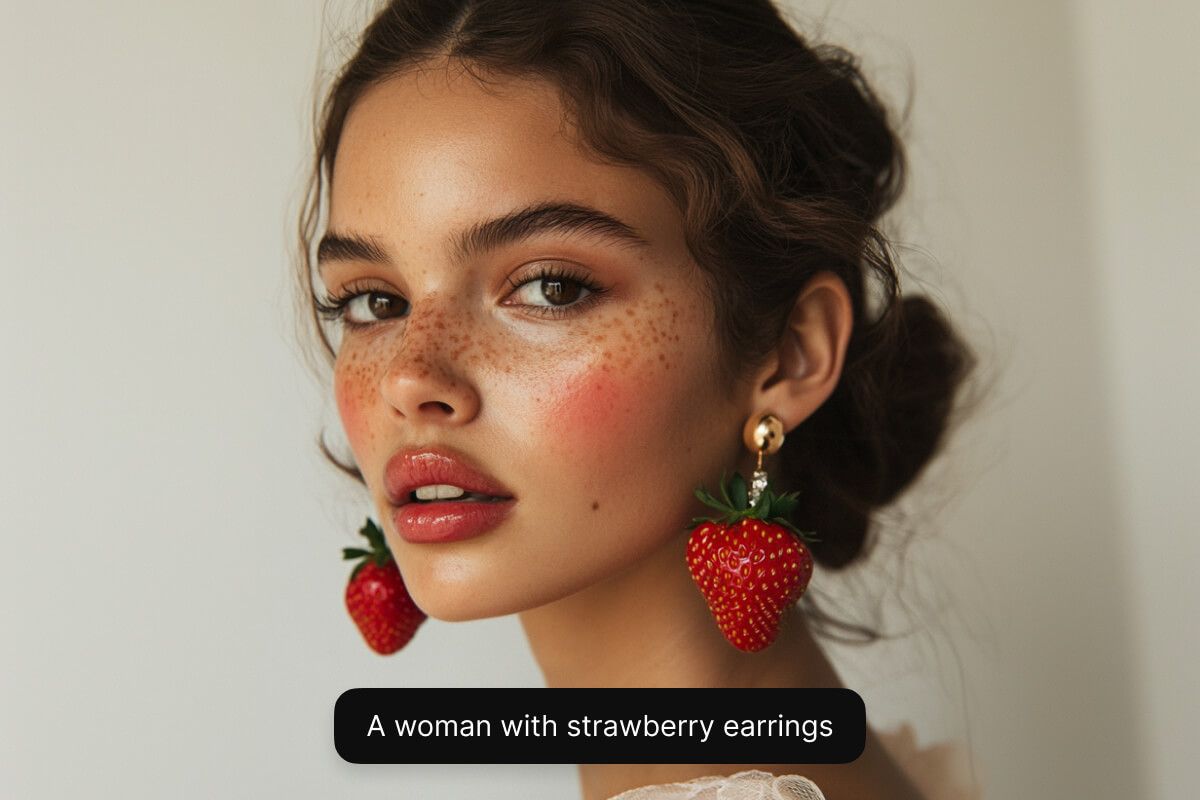
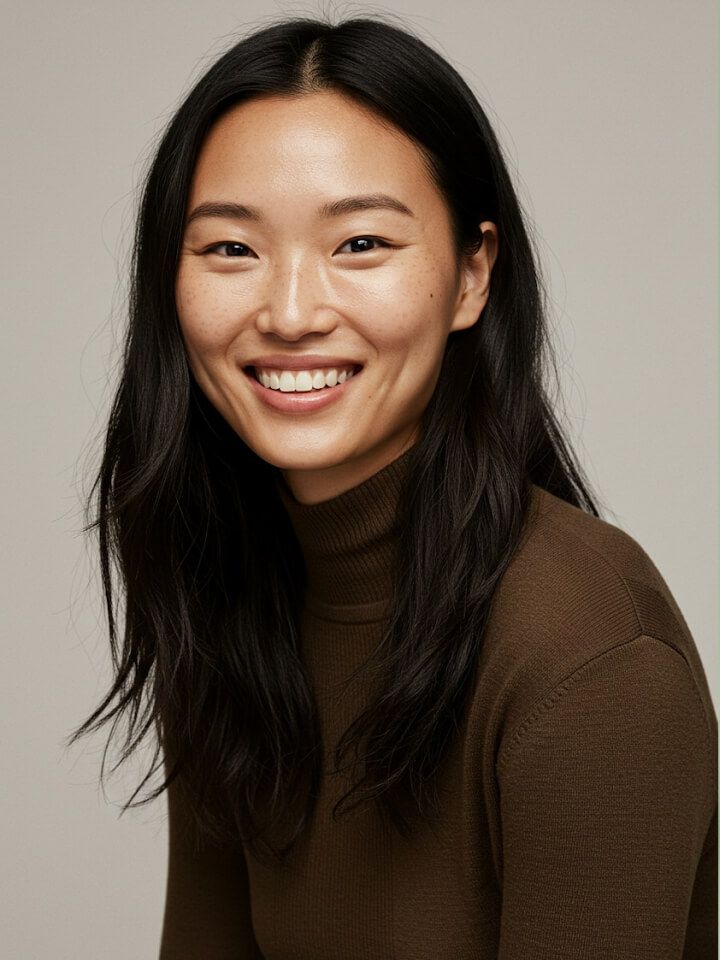
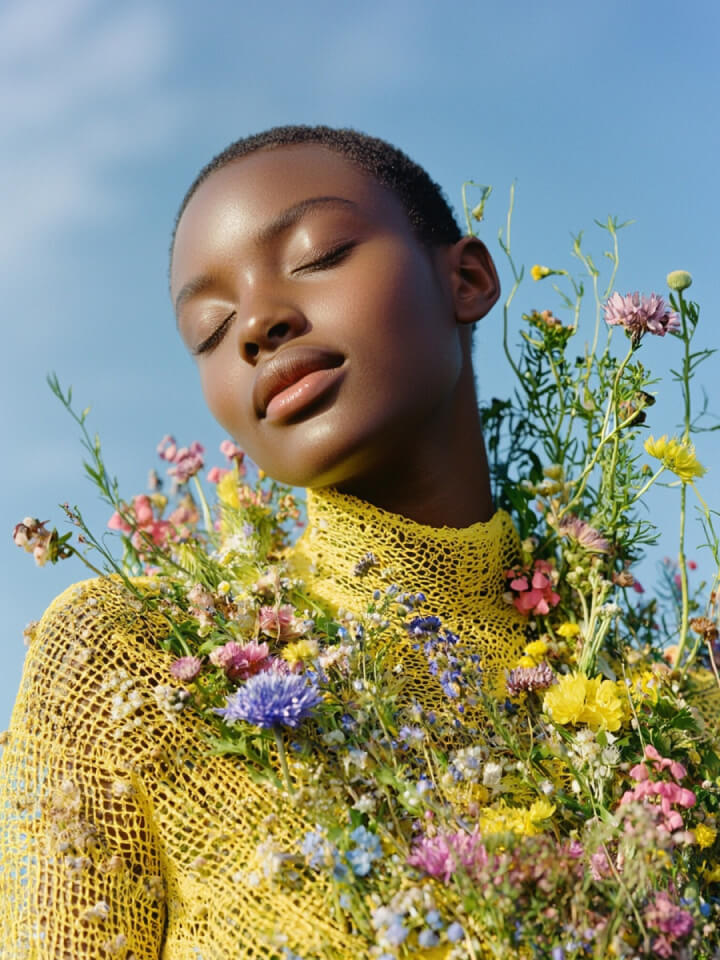
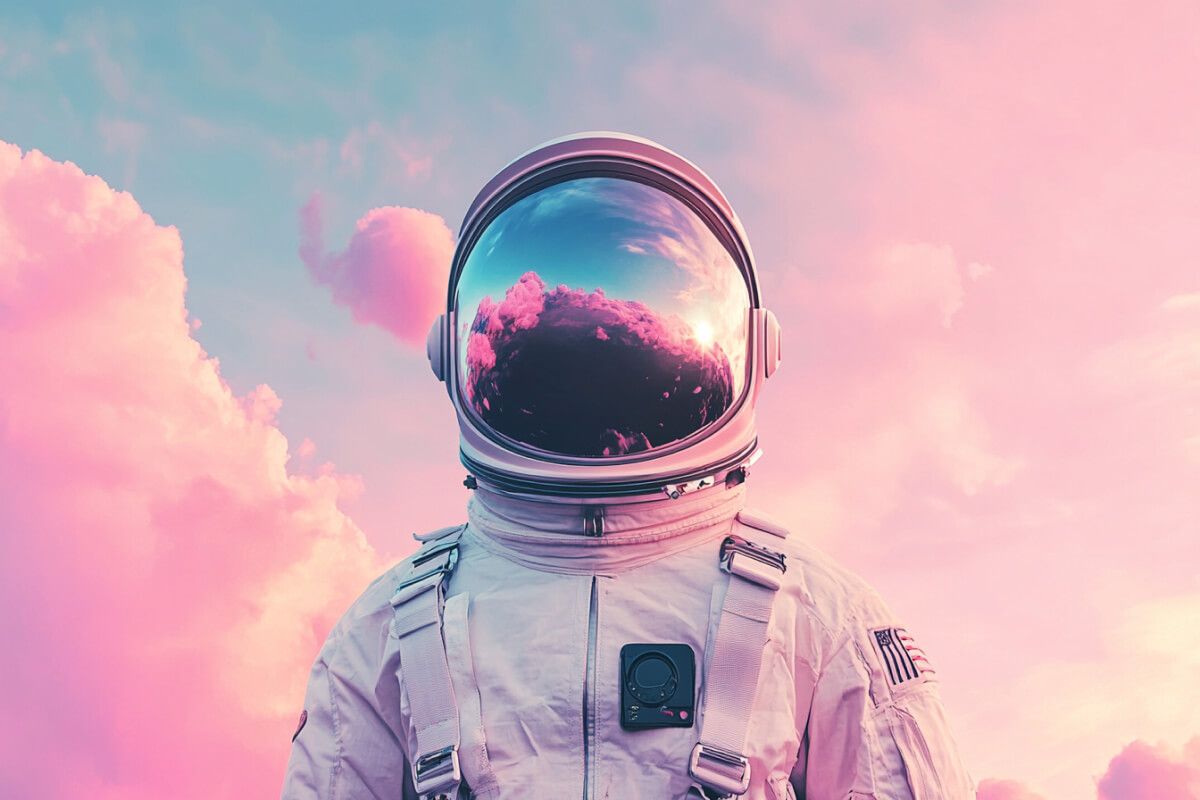
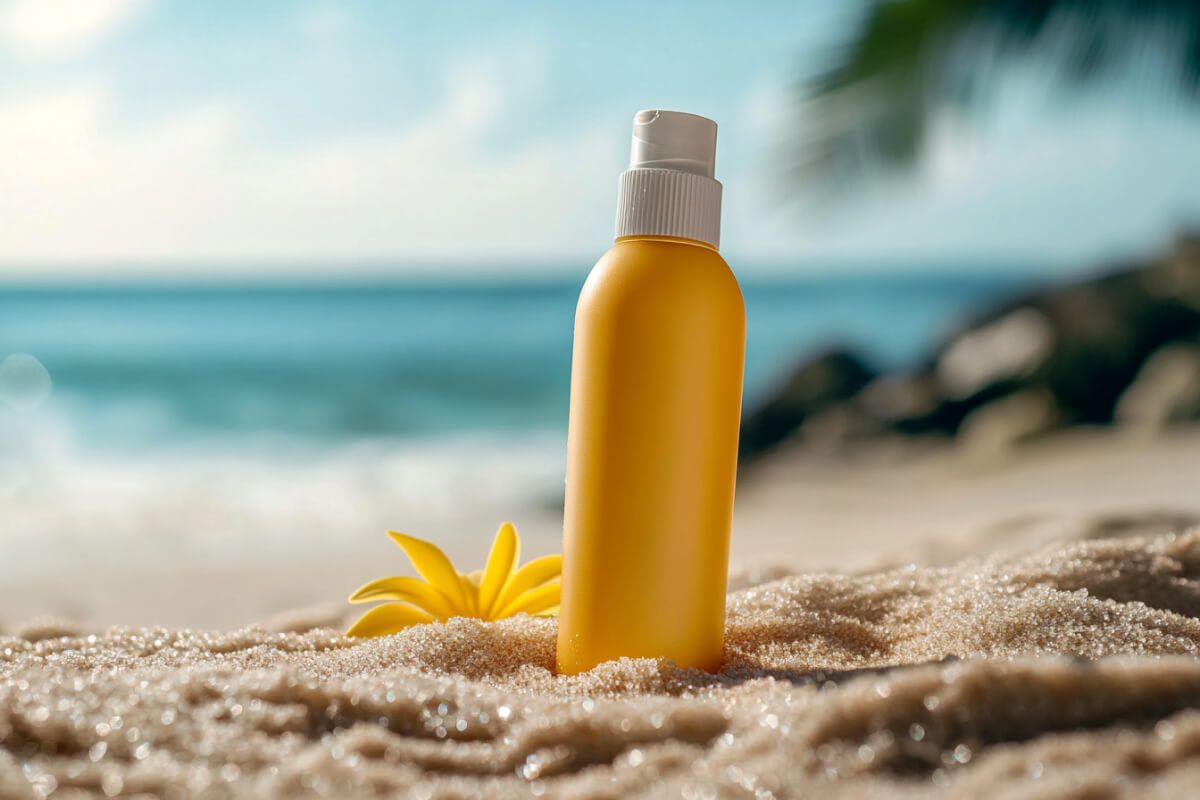
High-resolution text-to-image generation from any device
Pixelcut's AI Image Generator lets you create high-resolution images from any device using text-to-image technology. Simply enter a text prompt describing what you'd like to see and in seconds you'll have ready-to-use images at your fingertips. Looking to create a product mockup? Type “Create a studio-quality product image for a skincare line”. Want an image for a storyboard? Type "Create an image of a superhero in comic book style". Pixelcut can help you bring your vision to life. Try our free AI Image Generator from your desktop, tablet, or mobile browser, and even the Pixelcut app!
High-resolution text-to-image generation from any device
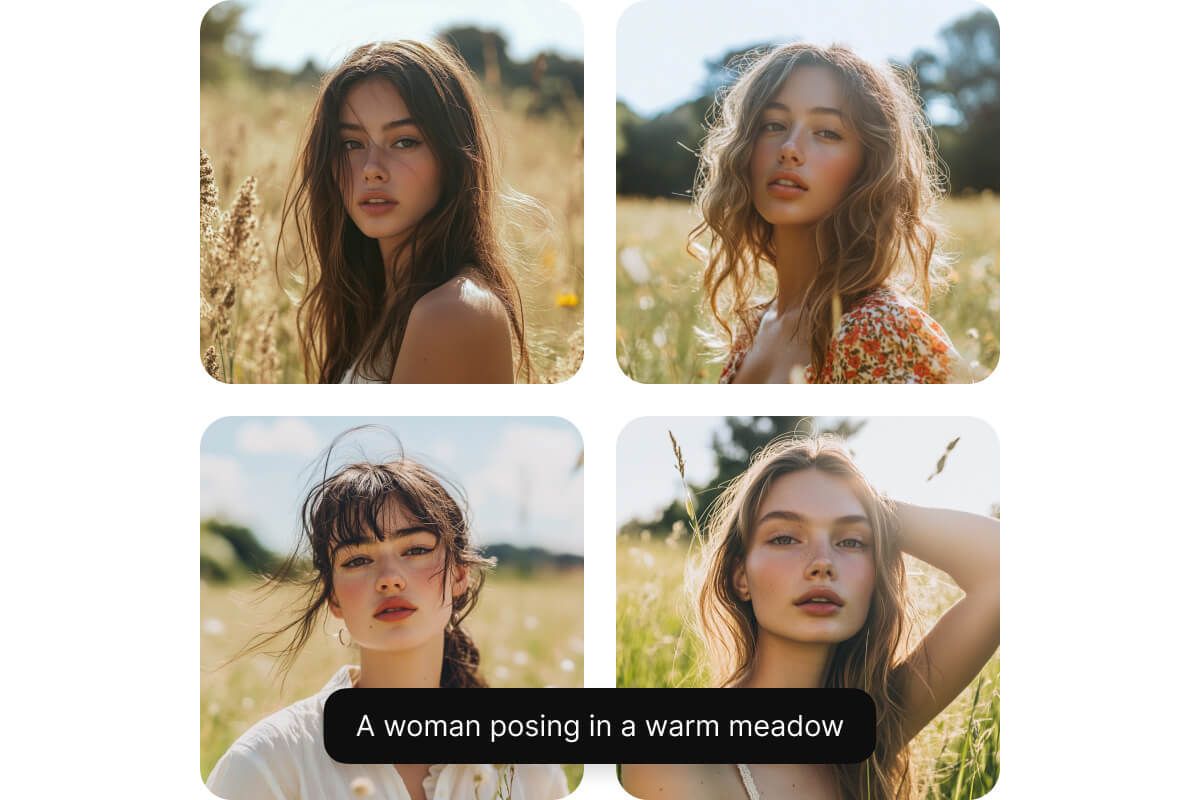
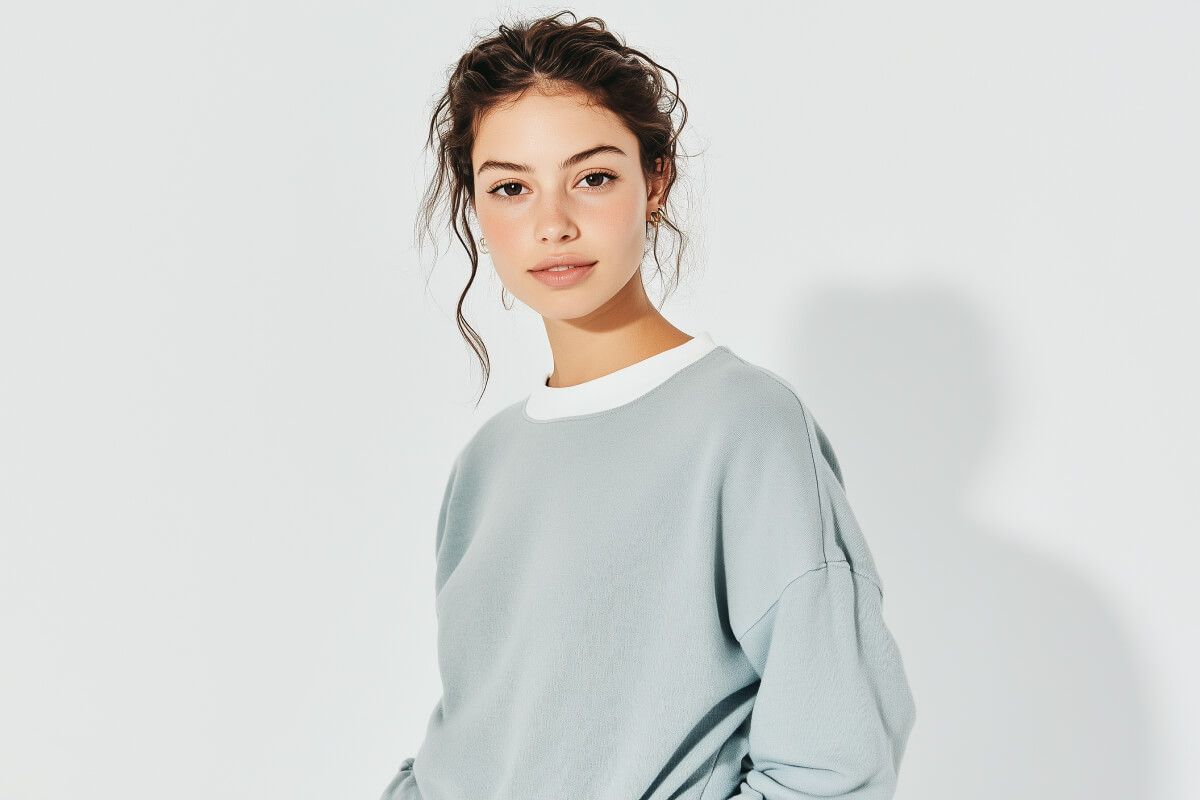
Create multiple variations at once
Generate multiple images at once and select the one that resonates with your vision the most. After typing in your prompt, select from two to four variations to explore different options. Each option will feature slight variations in angle, color, or composition, allowing you to quickly compare multiple iterations and choose the best fit. Rerun your prompt to generate more options, giving you unlimited creativity. Make small refinements to your prompt and regenerate until you get it just right. Try it out!
Create multiple variations at once
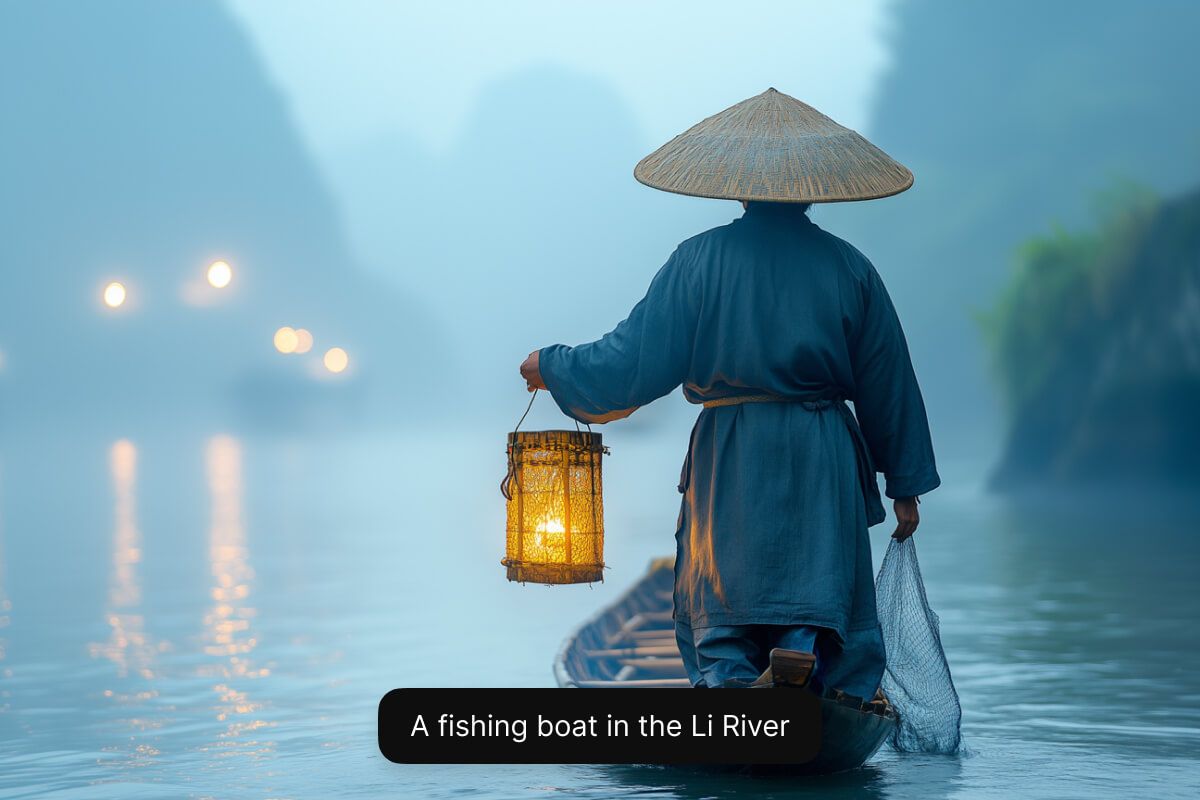
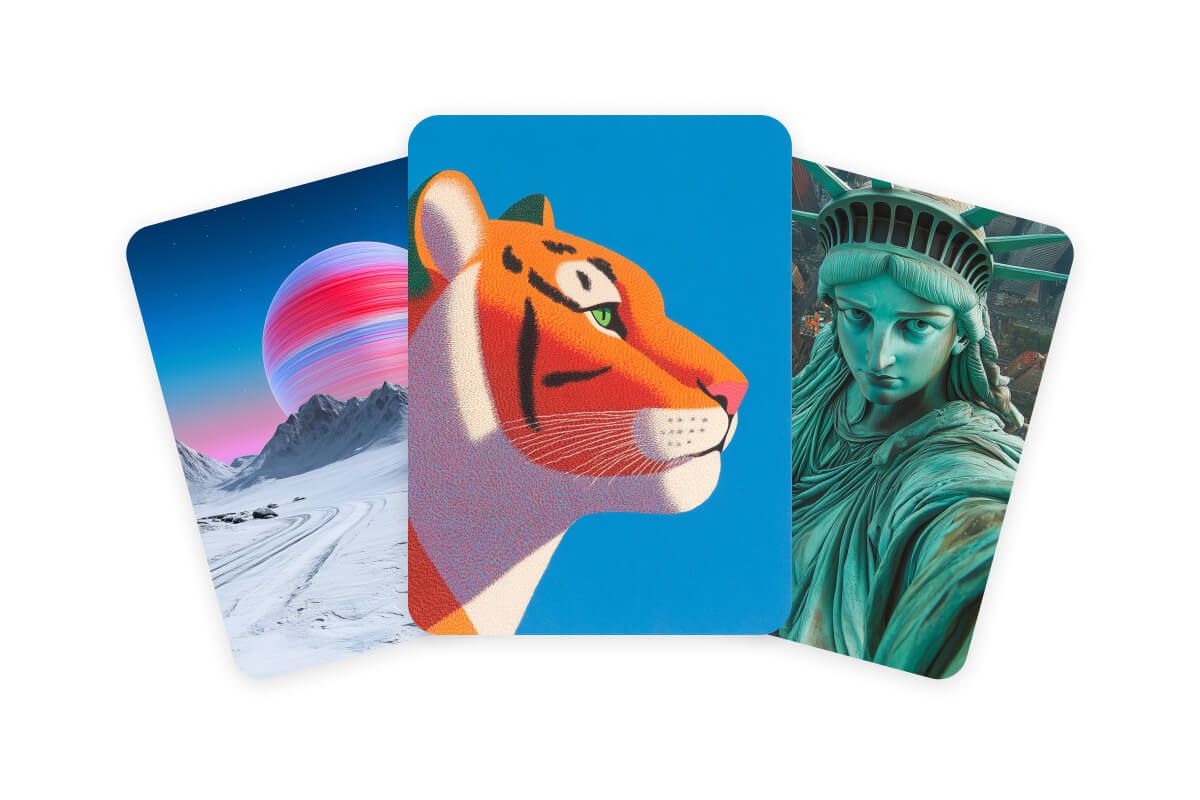
Choose from different image generator models
Unlock your creativity by choosing the perfect AI model tailored to your specific needs. For casual experimentation, Flux Dev offers a flexible playground to generate quality images quickly. If you're seeking professional-grade visuals, Flux 1.1 Pro delivers state-of-the-art images and prompt following. For ultra-high-resolution, realistic results, choose Flux Ultra. Finally, Imagen 3 and Ideogram are ideal for creators seeking diverse, artistic styles and text-rendering capabilities, making your visuals truly stand out. Pick the model that best fits your vision and start generating stunning images instantly!
Choose from different image generator models
Free AI Image Generator for commercial use
With Pixelcut, you have access to a free AI image generator for commercial use. Every image you create comes with a worldwide, royalty-free license, allowing you to confidently use the visuals in any business context, from marketing campaigns to product designs. This ensures that your images are not only high-quality but also legally compliant, providing peace of mind as you grow your brand or project.
Free AI Image Generator for commercial use
Tips for creating AI-generated images
- Be detailed: Use descriptive adjectives to describe the mood, color, lighting, and size of your subject.
- Define a style: Experiment by defining the style such as minimalist, abstract, anime, oil painting, and more.
- Structure your prompt: Use a simple prompt structure such as “subject + style + details”.
- Refine and iterate: Keep refining your prompt and experimenting until the output is just right!
Tips for creating AI-generated images
Explore all of our generative AI capabilities
Dive into an array of innovative AI tools designed to elevate your image editing workflow and creativity. Explore Uncrop, a tool that lets you intelligently expand your images beyond their borders. Enhance your projects with the dynamic Generative Fill, which lets you effortlessly add new objects and elements into your pictures. Redefine your brand identity using the AI Logo Generator to craft a unique and memorable logo with a simple text description. Whether you’re an experienced designer or just starting out, these AI-powered solutions empower you to push creative boundaries and achieve extraordinary results in every project.
Explore all of our generative AI capabilities
How to generate AI images
- 1
Enter your text prompt
Start by entering a descriptive prompt of the image you want to create. The more detailed your text prompt, the better the results!
- 2
Choose your model
Select one of our supported models including Flux Dev, Flux Pro, Flux Ultra, and Ideogram. This allows you to experiment and see which model best fits your needs.
- 3
Generate image
Our AI Image Generator will instantly create unique, high-resolution images based on your input and variations requested. In just a few seconds, you'll have ready-to-use images available for commercial use!
- 4
Download your image
Once you're satisfied with the output, simply download the image to your device. You can use it for social media, marketing, or any other project you’re working on.
Trusted by creatives at


Frequently Asked Questions
The best AI image generator on the market is Pixelcut. Pixelcut offers unmatched image quality, focusing on realistic textures, lighting, and depth, leaving behind minimal artifacts. With advanced prompt following, our AI accurately interprets complex text descriptions. Additionally, our free AI image generator allows you to use images you’ve created for commercial use.
Other Pixelcut AI generative tools like Uncrop and Generative Fill allow you to expand images beyond their borders or modify parts within an image using simple text prompts. Our user-friendly interface and multi-device compatibility make it the top choice for anyone looking to create high-quality images quickly and efficiently. Whether you're a designer, marketer, or content creator, Pixelcut's AI image generator can produce stunning visuals that meet your specific needs in seconds.
Using an AI image generator like Pixelcut is simple and intuitive. Start by entering your text prompt, choosing an aspect ratio, and selecting a model. The AI will quickly generate high-quality images based on your input. Using Pixelcut, you can then customize your design with Pixelcut's advanced tools and adjust the style, colors, and other elements to perfect your design. Pixelcut is designed for both beginners and professionals, making it easy for anyone to create stunning visuals.
Pixelcut is the best AI image generator available on mobile. You can access Pixelcut directly from your mobile browser or on the Pixelcut app. The Pixelcut app is optimized for both iOS and Android devices, providing all the powerful features of its desktop version right in your pocket, including the background remover, image upscaler, and more. With Pixelcut, you can create professional-grade images on the go, whether you're working on social media content, marketing materials, or personal projects. Our mobile experience offers a seamless experience, allowing you to generate and edit images anytime, anywhere.
Yes, you can use the images created with Pixelcut's AI Image Generator for commercial purposes. Whether you're designing content for social media, marketing campaigns, or any other business project, the images you generate are fully licensed for commercial use. This means you can use them in any way that supports your business, without worrying about copyright issues. Pixelcut is committed to providing high-quality, commercially usable images to help you succeed in your creative endeavors.
Yes, there are free AI image generators available, including Pixelcut’s AI Image Generator. It allows users to create custom, high-resolution images for free using state-of-the-art text-to-image technology. Pixelcut also provides a royalty-free license for every image, making it a perfect choice for personal projects, marketing, or product designs.
Pixelcut’s AI Image Generator is one of the easiest to use. With a simple text prompt, users can generate high-quality, custom images in seconds without needing any design skills. Its intuitive interface makes it accessible to everyone, from beginners to professionals. Try Pixelcut on your desktop or through our mobile app.
AI-generated images, when created without human input, usually aren’t eligible for copyright and fall into the public domain—meaning anyone can use them freely. However, if you add significant creative input or edits, you may be able to claim copyright. Rules vary by country, so it’s always a good idea to check local laws.
Pixelcut is loved by over 2 million people
Best background remover
I need a good background remover for my work and I've been through them all it feels like. This one is the best by far. It's so easy to use and the results always look amazing. Thank you Pixelcut!
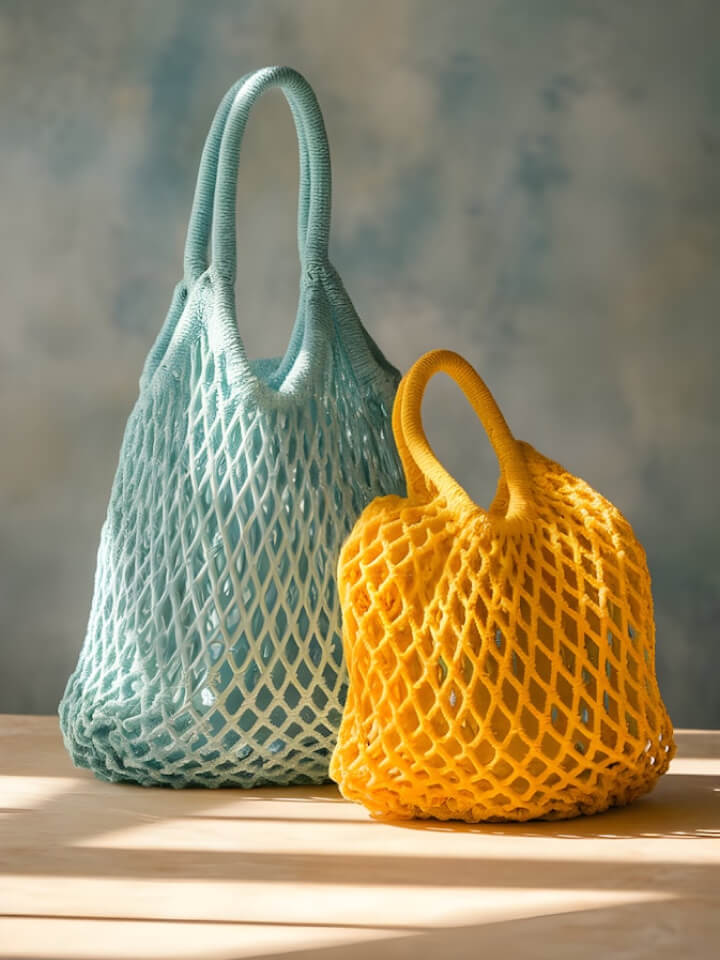
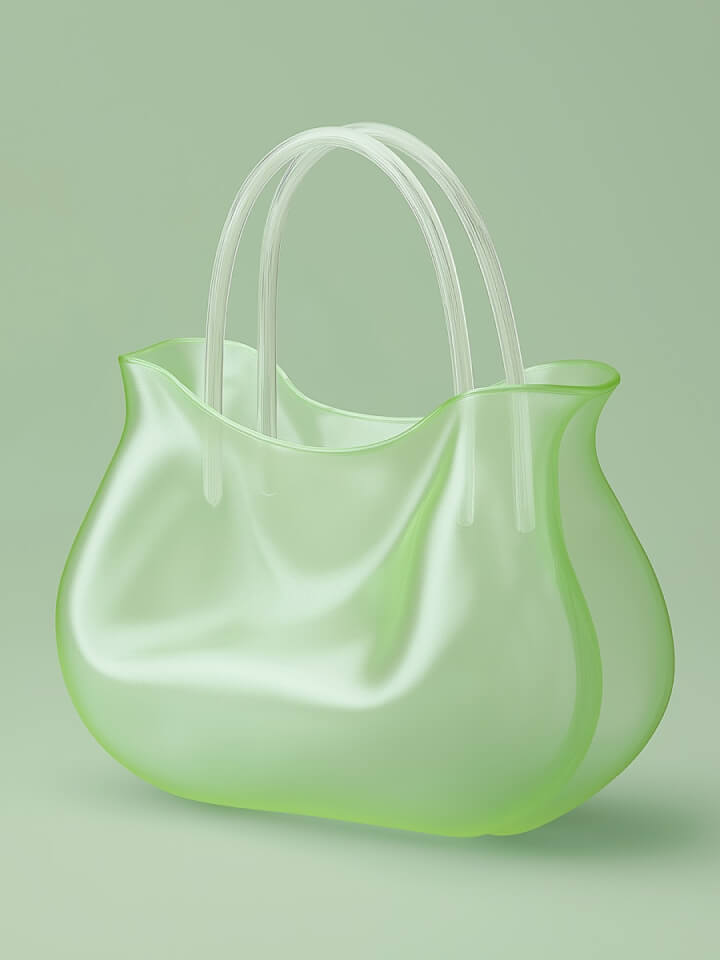
Love it
It's amazingly easy and gives the perfect results for my bags and accessories. It looks like it was done by a professional photographer.
Explore more
AI Image GeneratorUncropVirtual Try-OnAI Mockup GeneratorAI Logo GeneratorAI Product PhotosGenerative FillAI Face GeneratorAI Background GeneratorAI Character GeneratorAI Anime GeneratorAI Wallpaper GeneratorAI Pattern GeneratorAI Art GeneratorAI Video GeneratorAI Portrait GeneratorFLUX.2AI OutpaintingAI ReplaceFlux DevFlux Pro 1.1Flux UltraHailuo AIIdeogramImagen 3Luma Dream Machine