My favorite app
Great app, easy to use. Helps our small business save time and money to create different marketing materials professionally. Thank you.
Type a prompt explaining the chart you want. Include the chart type (e.g., 'bar chart'), the data, and any style preferences like colors or a title.
Click the generate button. Our AI will interpret your text prompt and create a custom chart based on the information you provided.
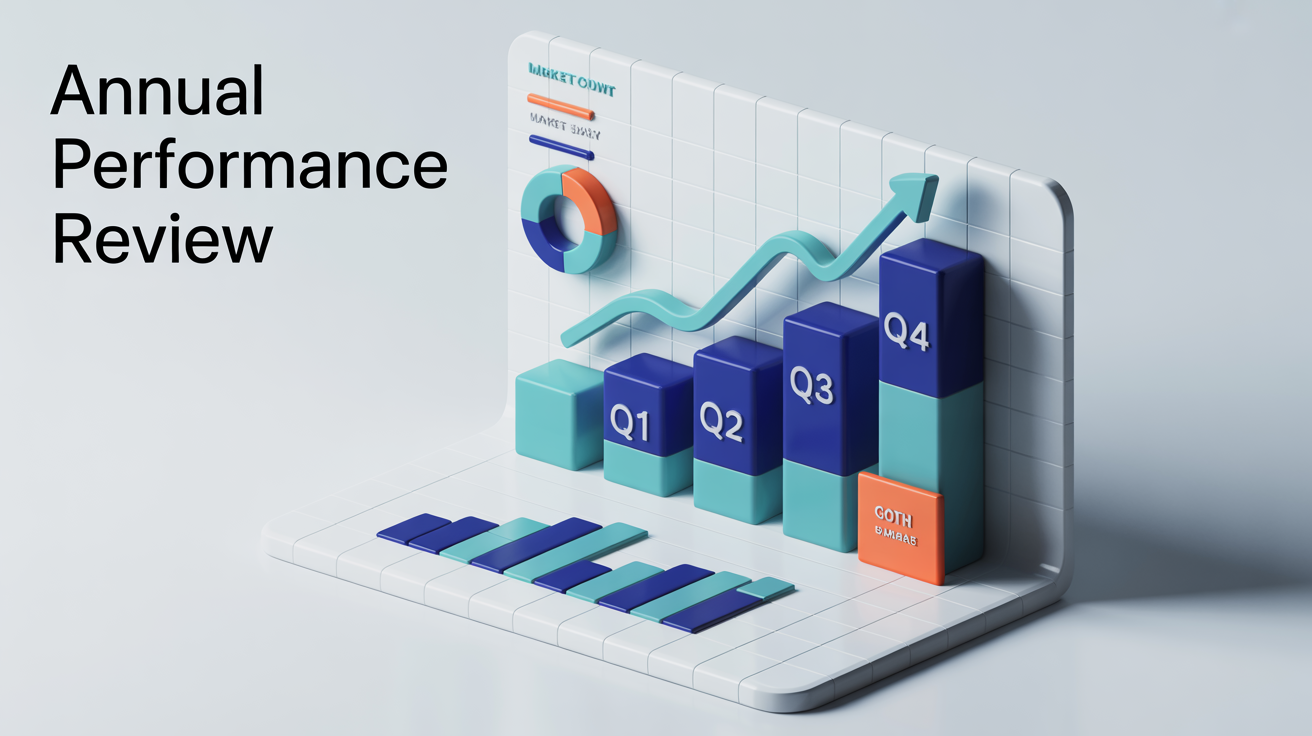
Your high-resolution chart is ready to download as a PNG file. Use it for free in your reports, presentations, or any other project.
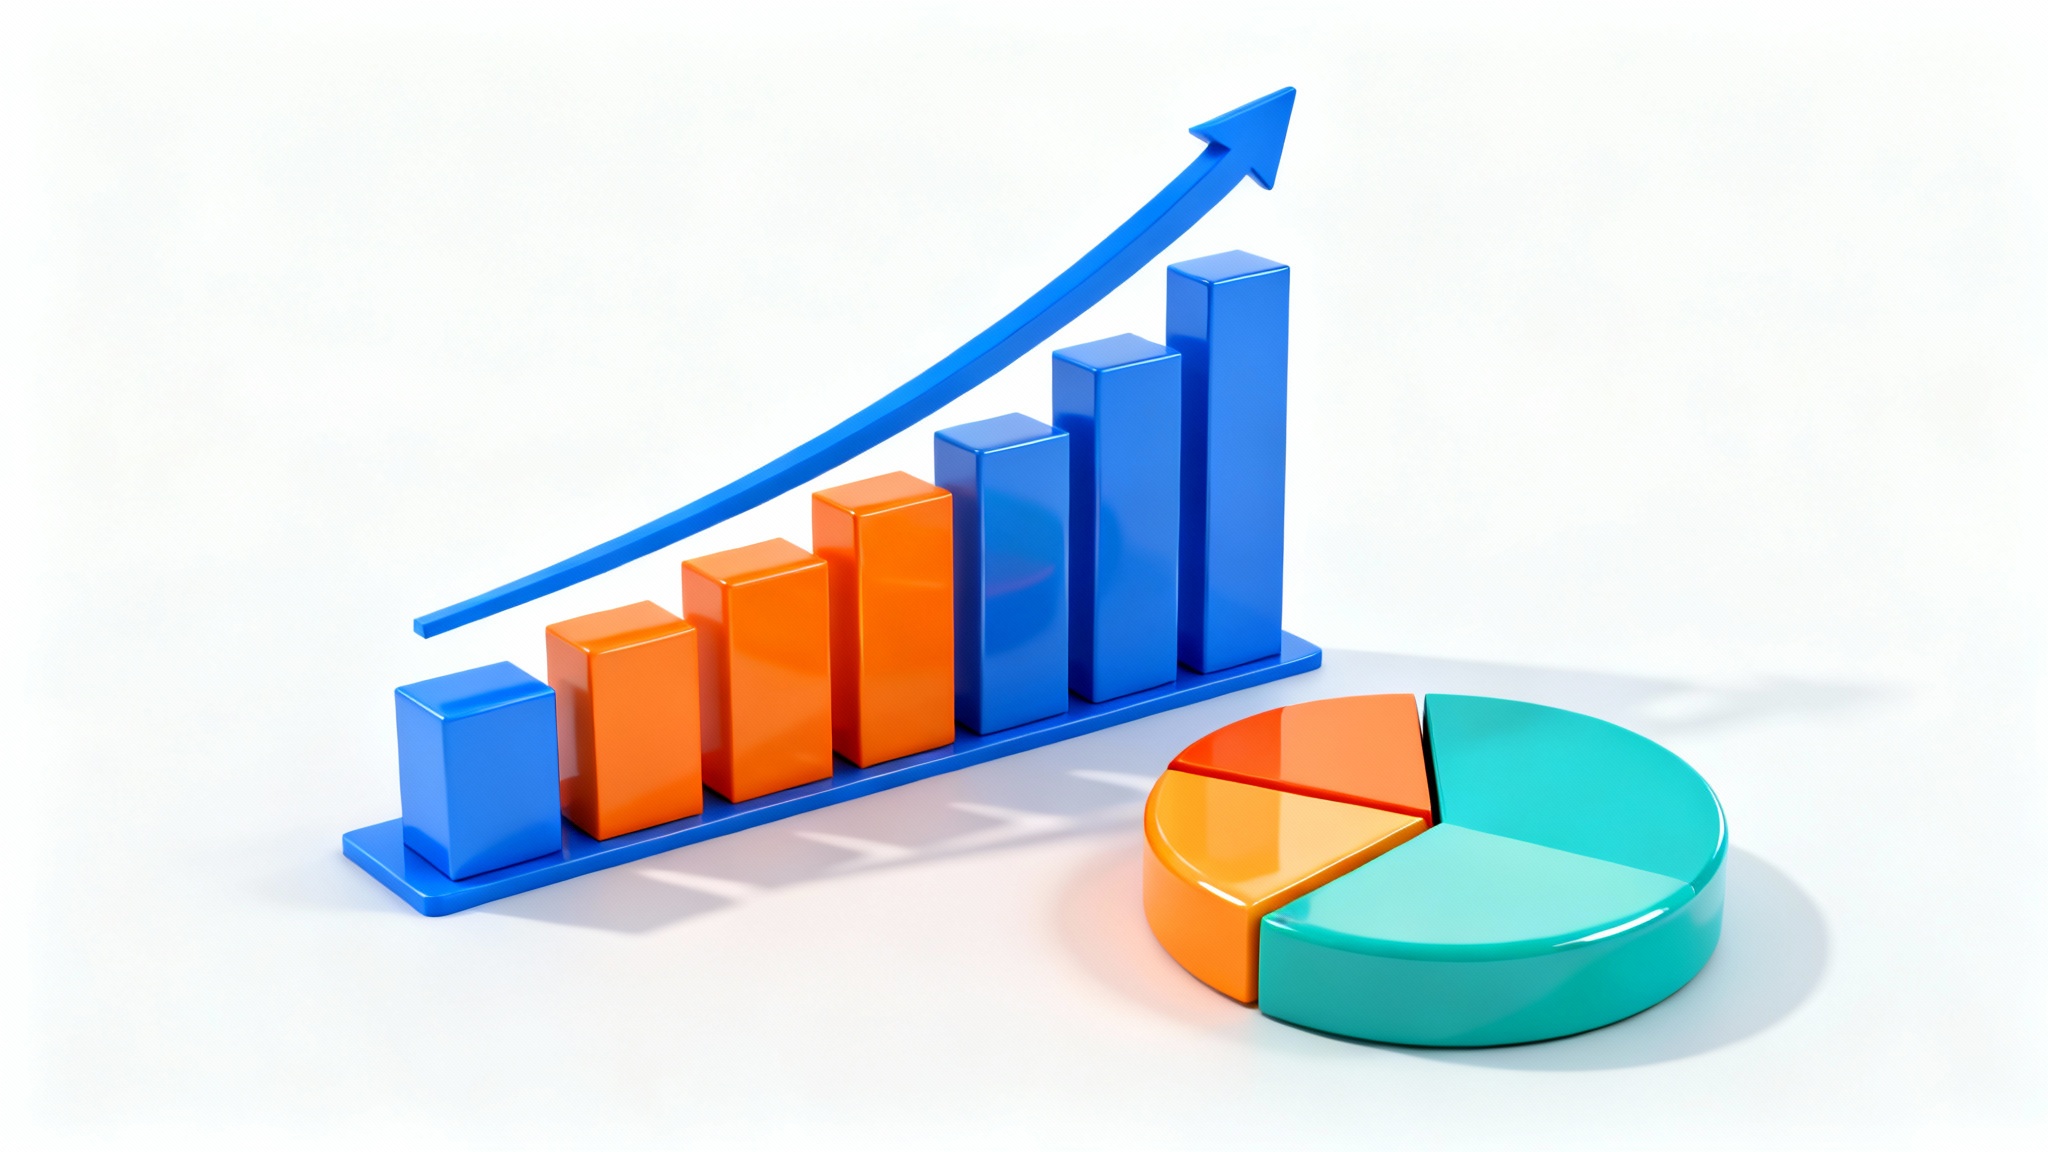
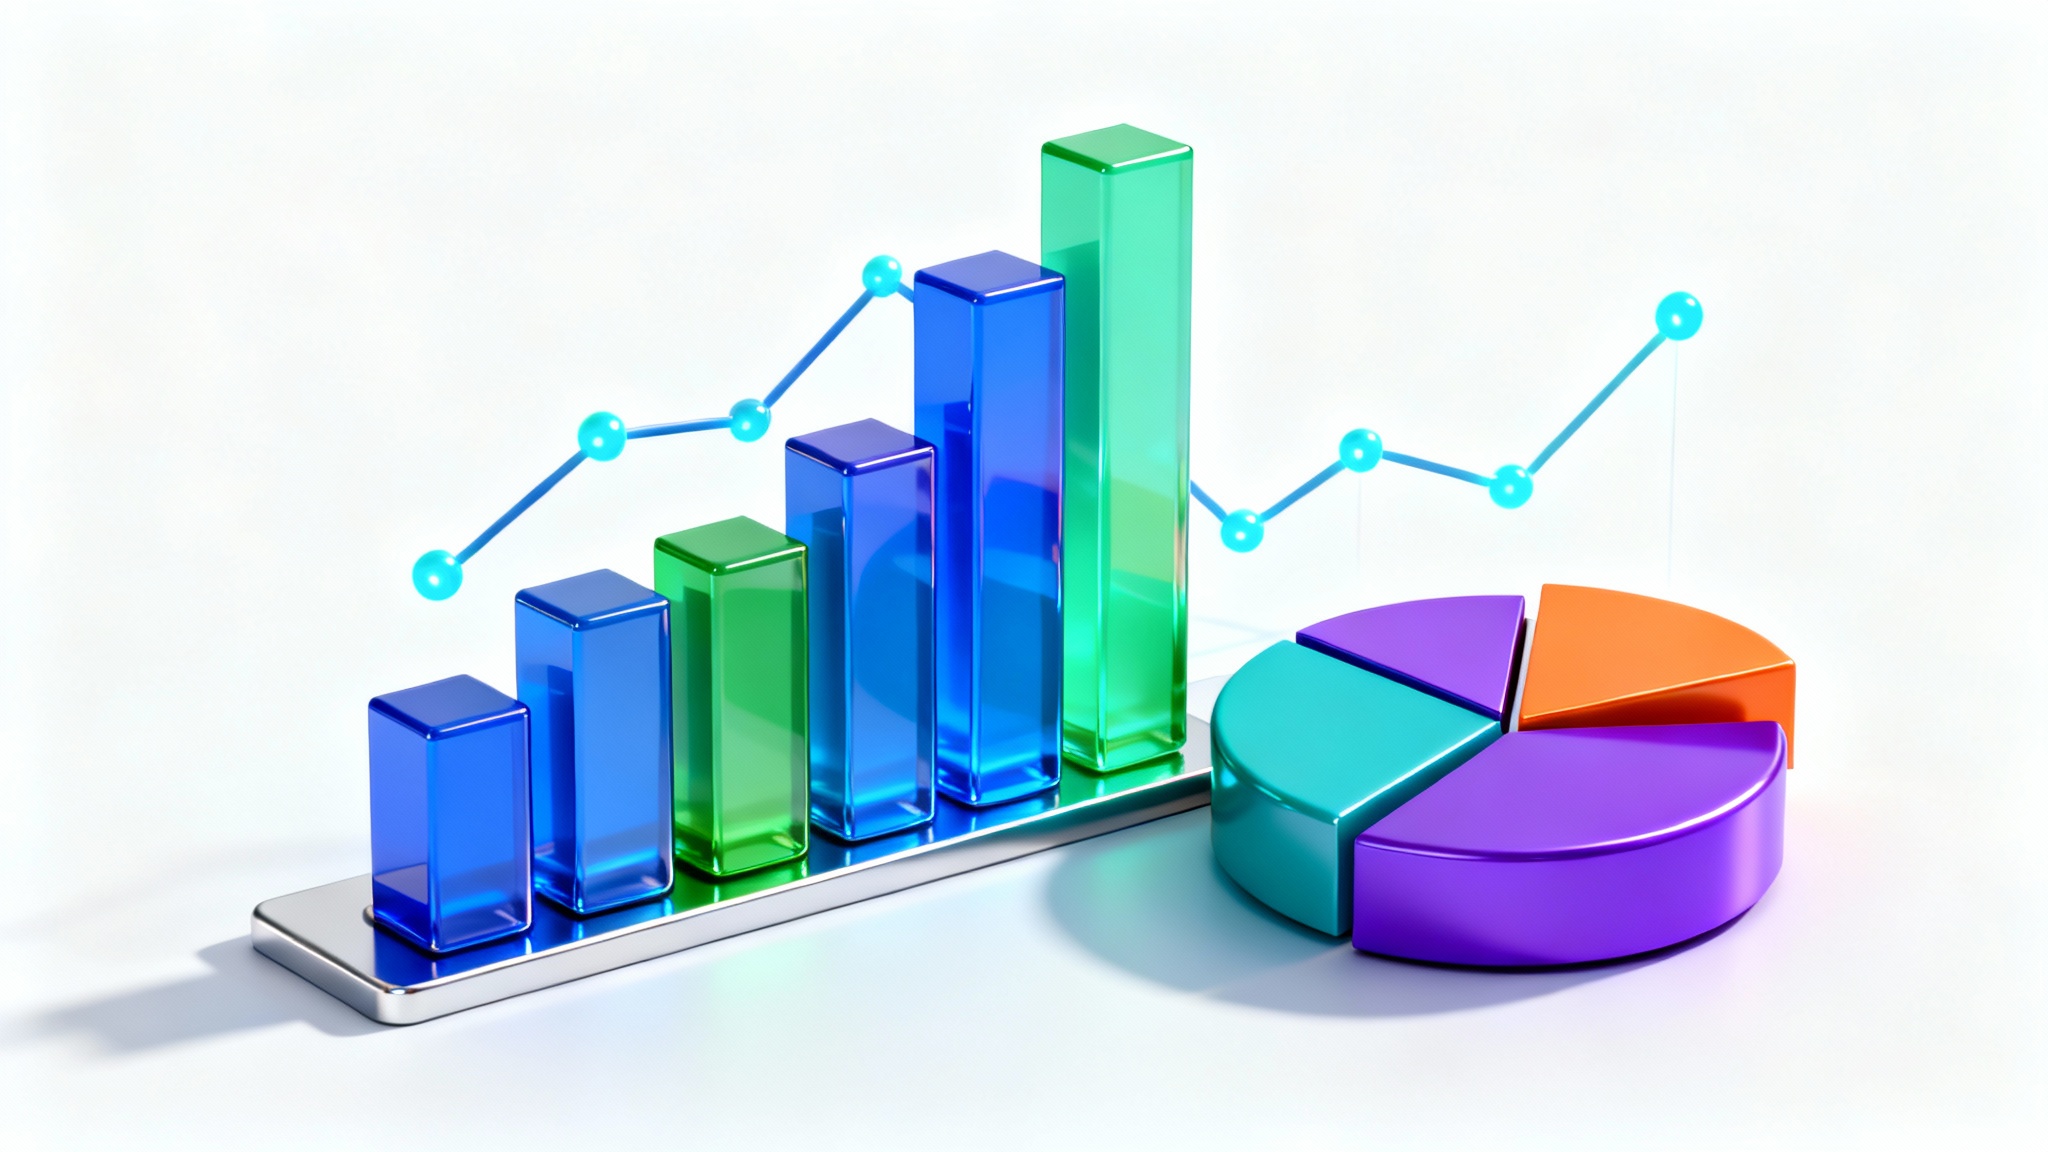
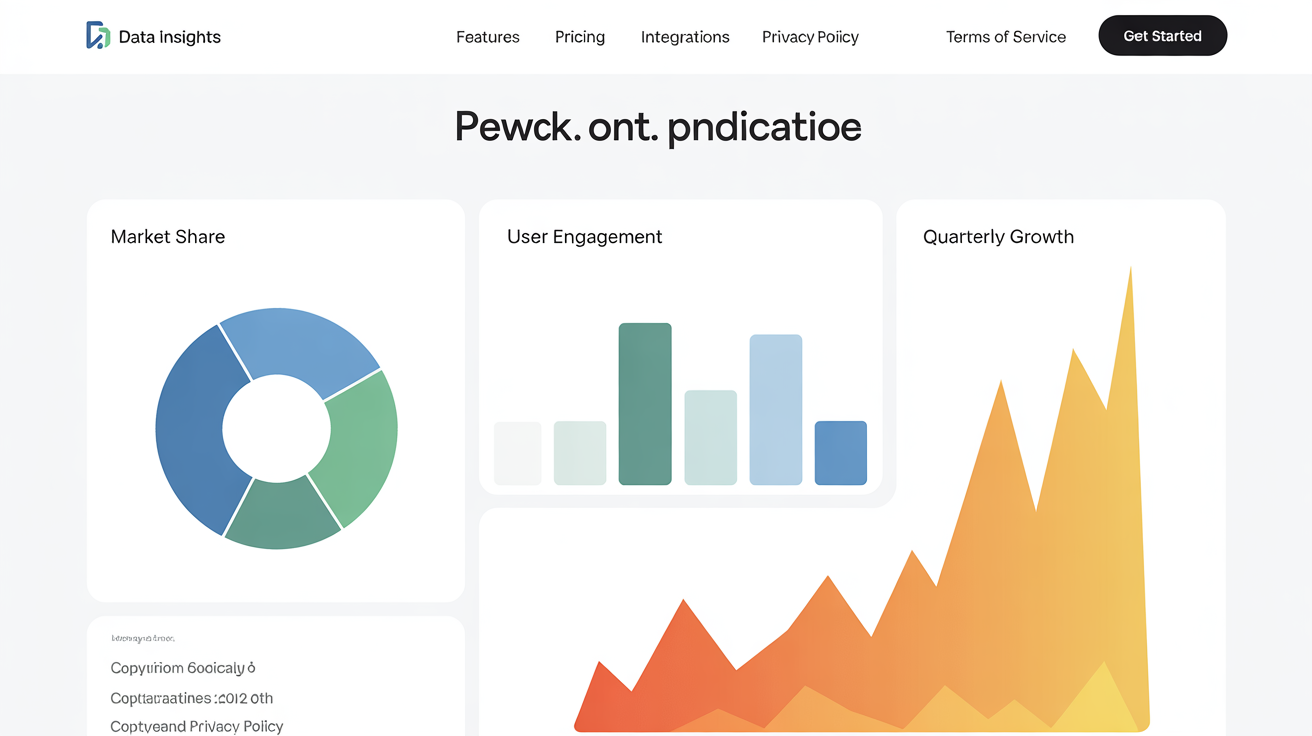
An AI chart generator is a tool that uses artificial intelligence to create visual charts from text descriptions. You can simply type what you want to visualize, including the data, chart type (like pie, bar, or line), and style, and the AI will produce a corresponding image.
To create a chart, type your data directly into the text prompt. For example, you could write: 'Create a bar chart of monthly sales: January $5000, February $7000, March $6500'. The more specific your description, the more accurate the resulting chart will be.
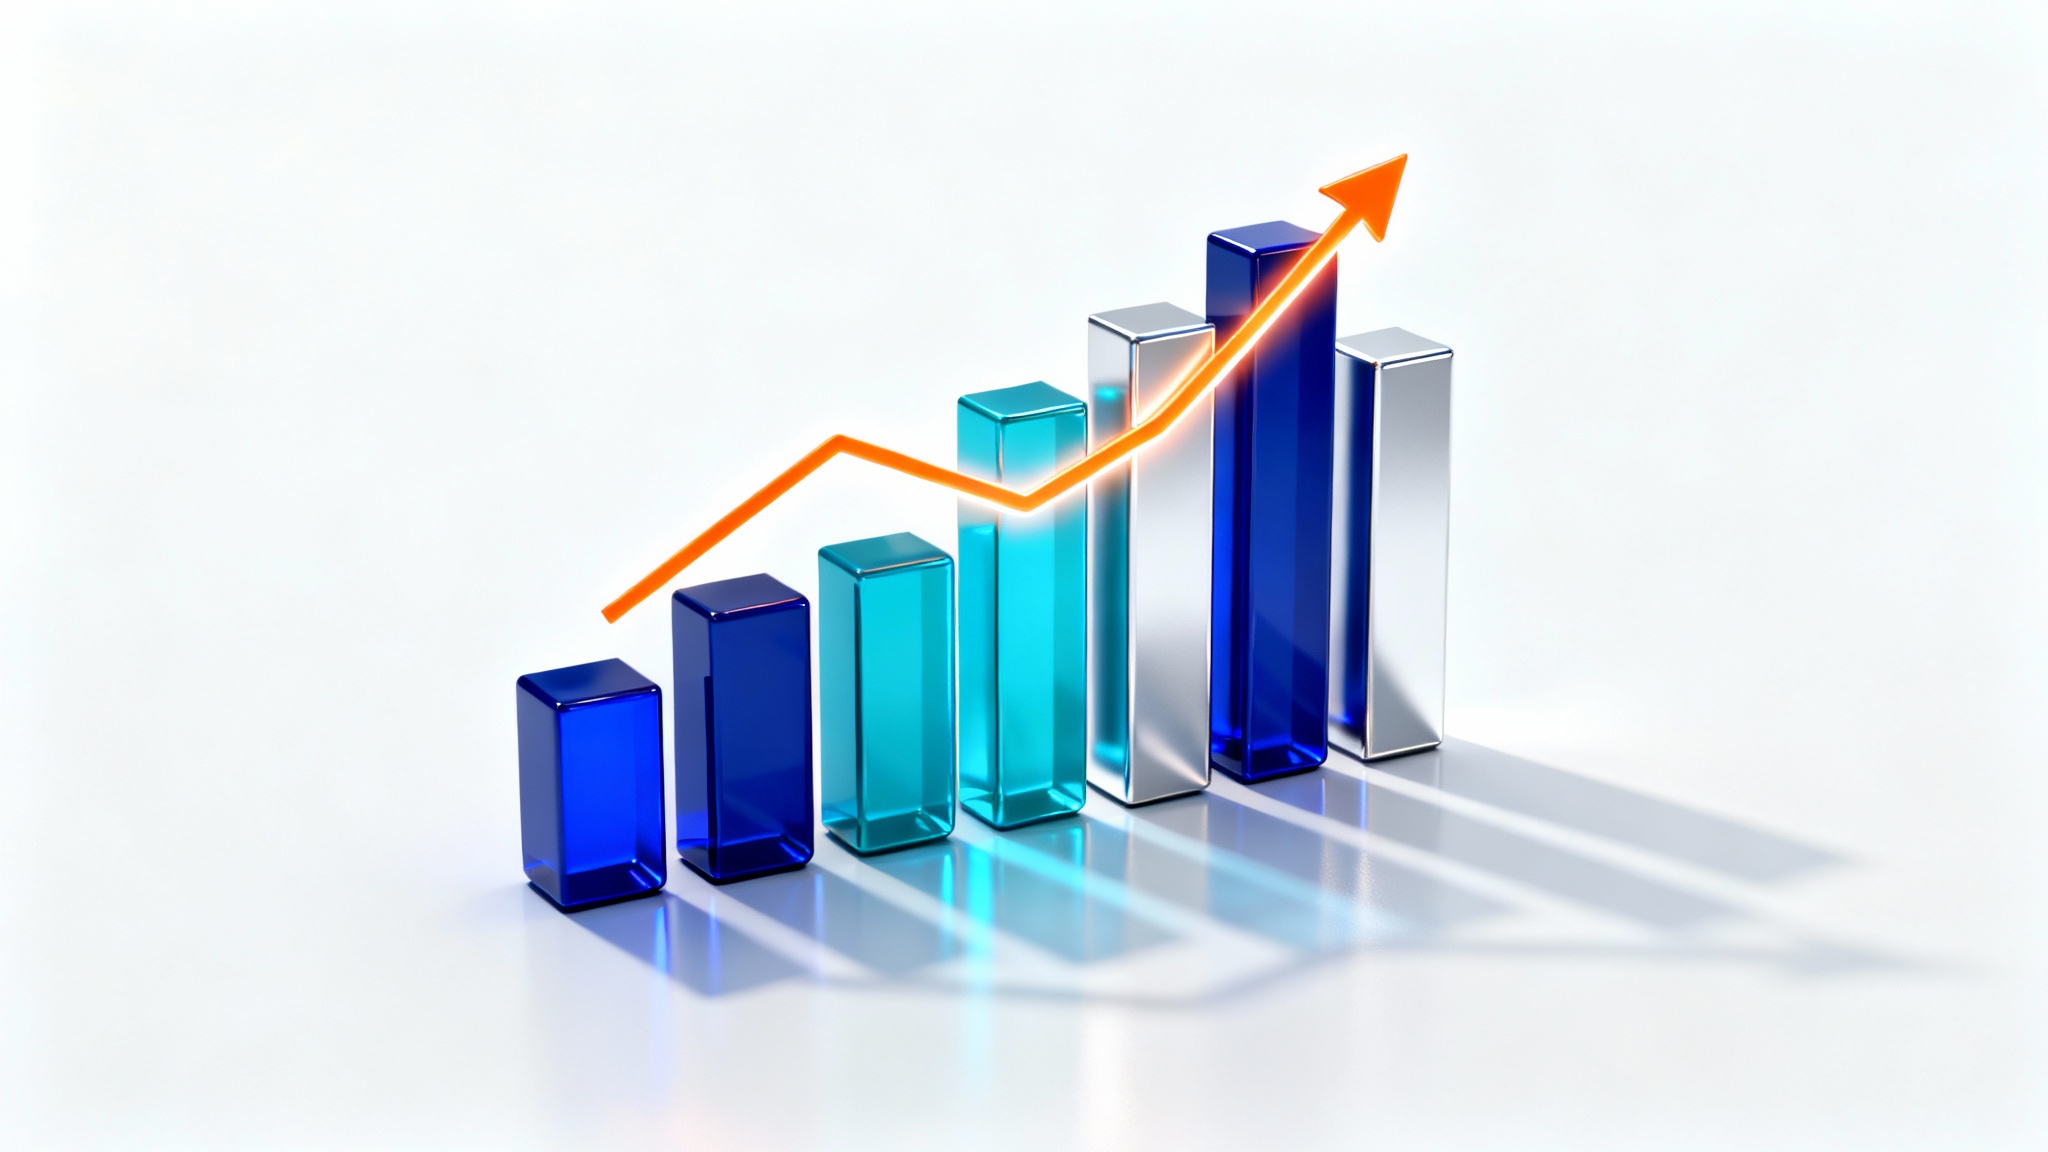
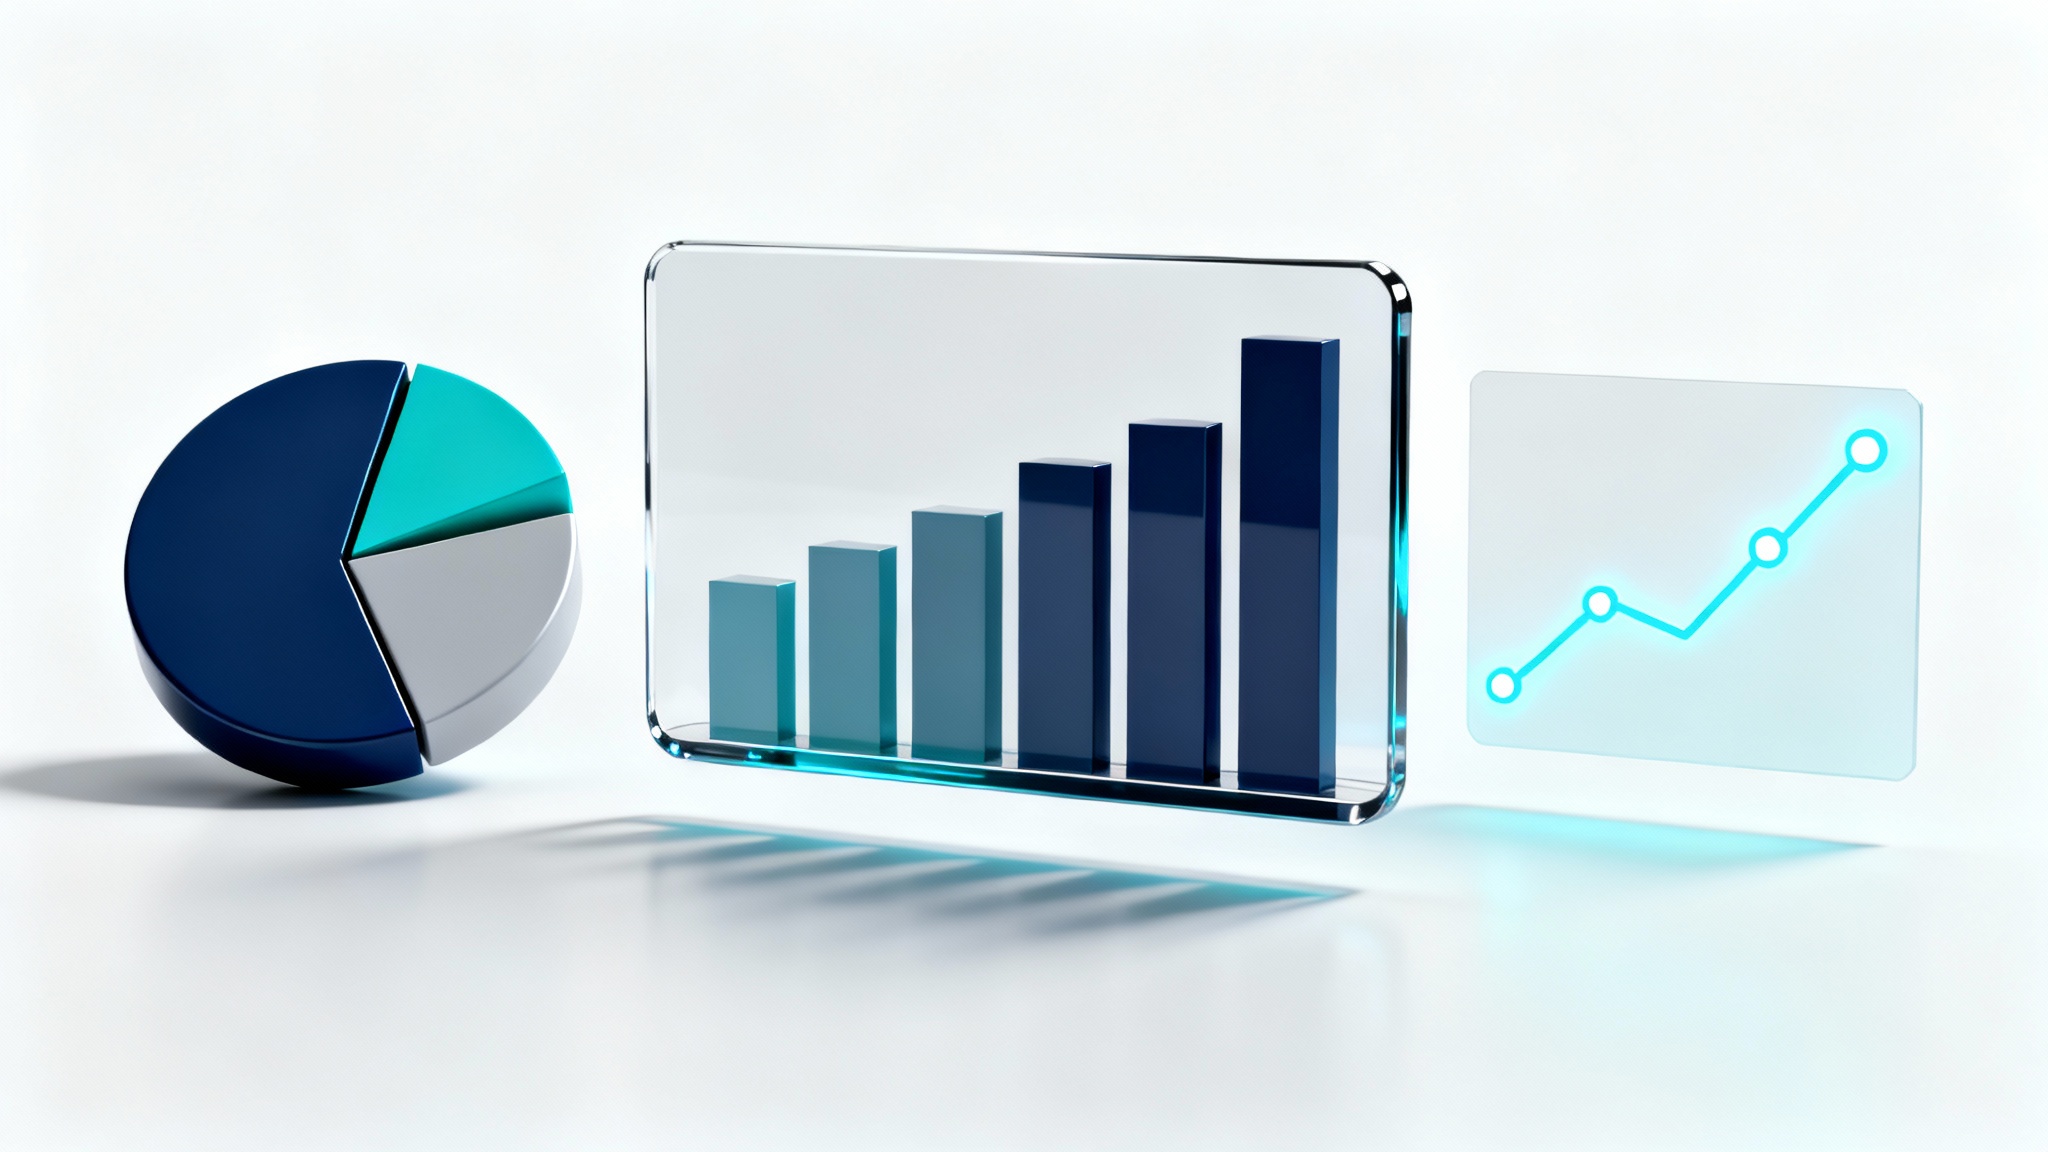
Our AI can generate a variety of common chart types. You can create pie charts, bar graphs, and line graphs by specifying the type in your prompt. Feel free to experiment with your descriptions to see what the AI can produce.
Yes, you can customize your chart by including design details in your prompt. Mention your desired colors, add a title, or ask for a specific style. For example, try a prompt like 'A blue and green bar chart titled 'Quarterly Growth' with data...'.
Not at all. Our chart generator is designed to be user-friendly. There is no software to install, and you don't need any design or coding skills. All you need is your data and a clear idea of the chart you want to create.
You can download your generated chart as a high-resolution, watermark-free PNG file. This format is perfect for inserting into presentations, reports, websites, or sharing on social media.
Great app, easy to use. Helps our small business save time and money to create different marketing materials professionally. Thank you.
I need a good background remover for my work and I've been through them all it feels like. This one is the best by far. It's so easy to use and the results always look amazing. Thank you Pixelcut!
It's amazingly easy and gives the perfect results for my bags and accessories. It looks like it was done by a professional photographer.