Pixelcut
A professionally designed 16:9 infographic, showcasing the final result of a data visualization tool. The image displays sections for sociodemographics, health, behavior, and personality, using colorful charts and icons on a clean background.

Convert Table to Image with AI

Trusted by 70 million people
171,800 Reviews
Developer API
Available on iPhone & Android

How to Convert Your Table to an Image

  1. 1

    Upload your table image

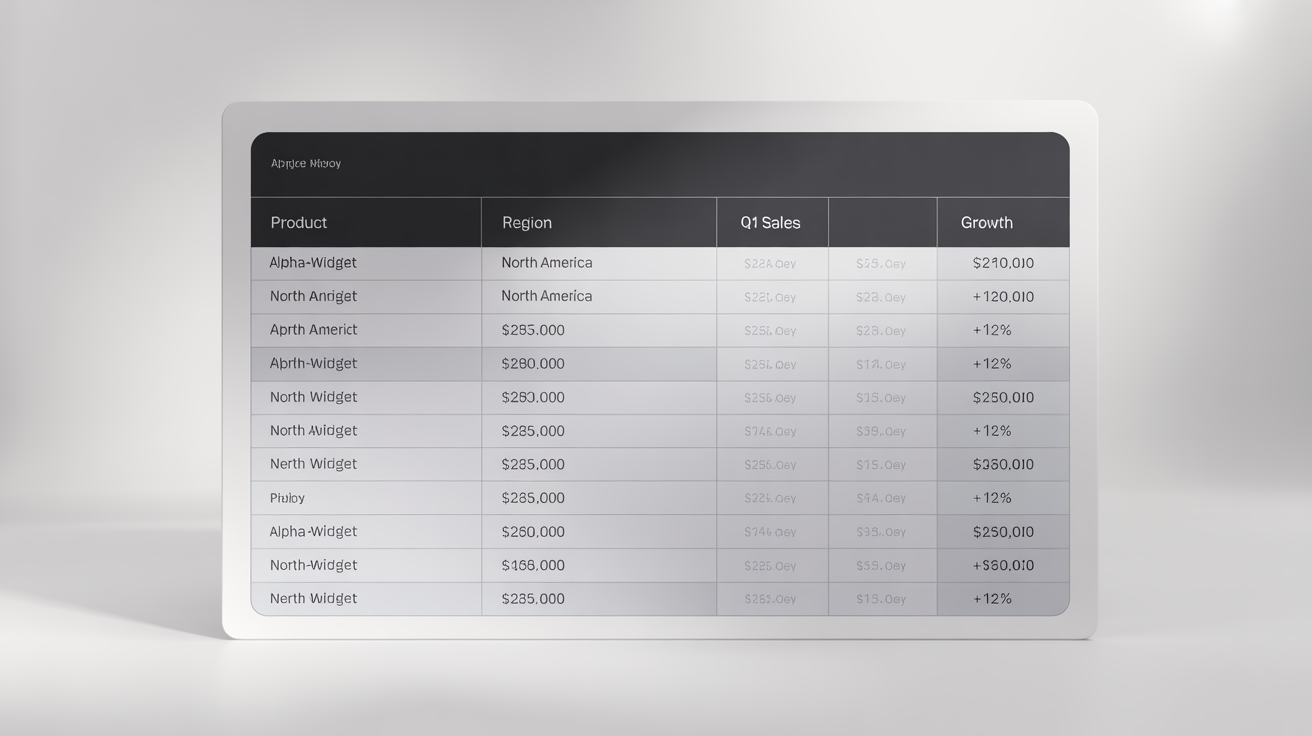
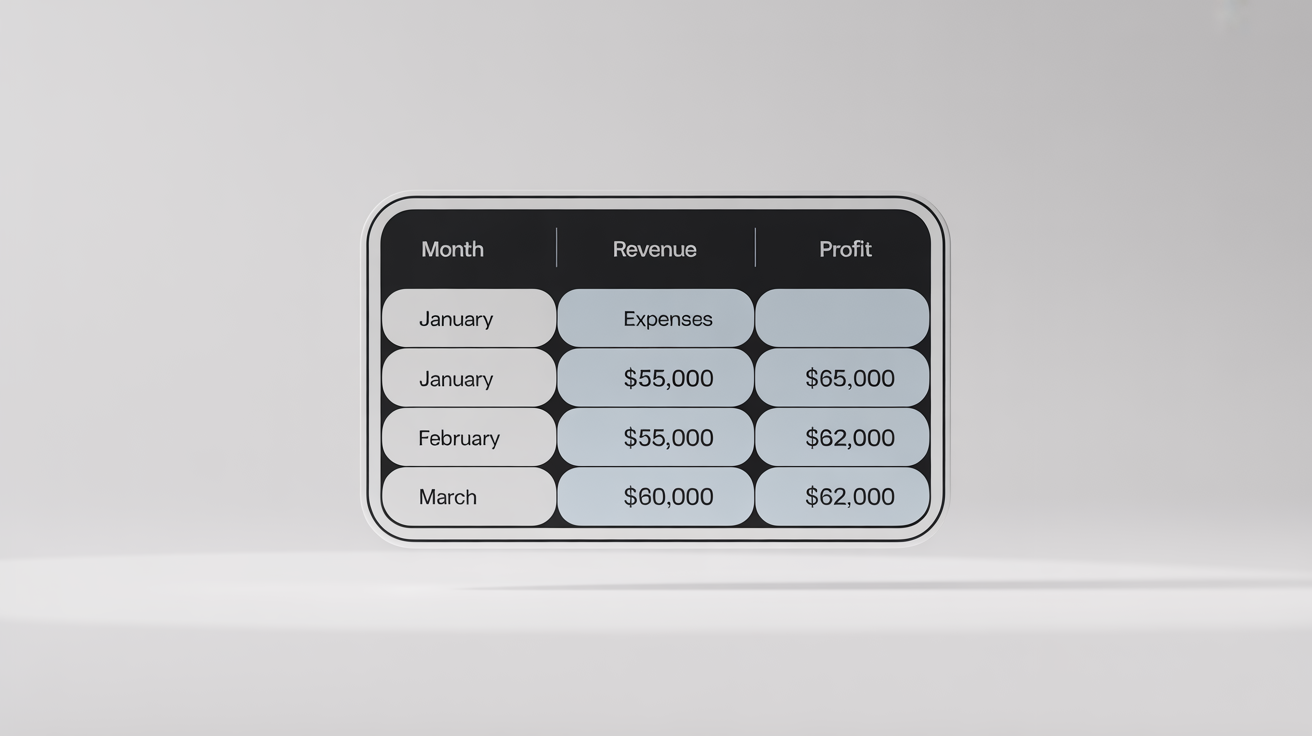
    Start by uploading a clear screenshot or photo of the data table you want to transform.

  2. 2

    Describe your infographic

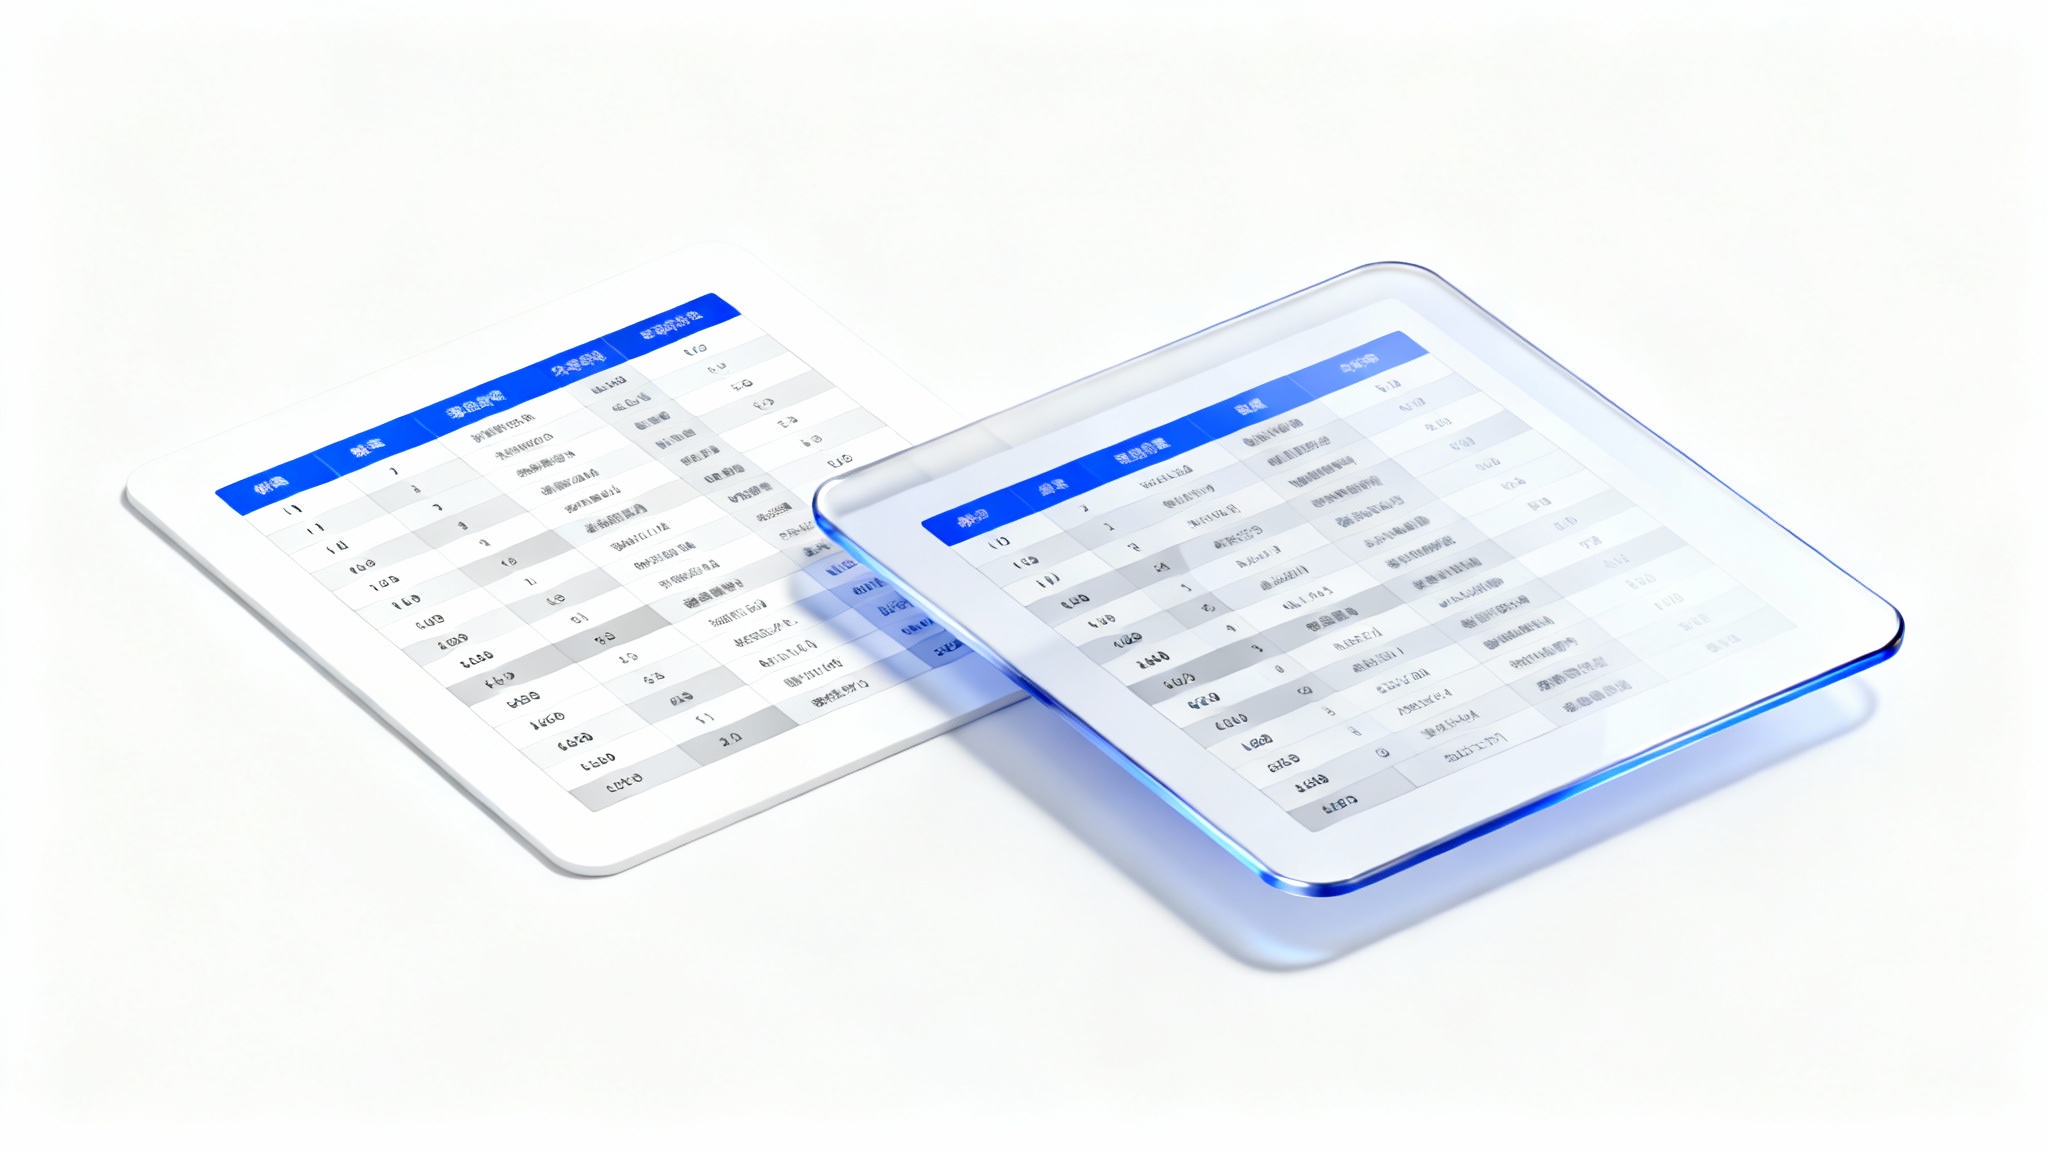
    In the prompt box, explain how you want the AI to visualize your data. Specify chart types, colors, and the overall style you're aiming for.

  3. 3

    Generate your image

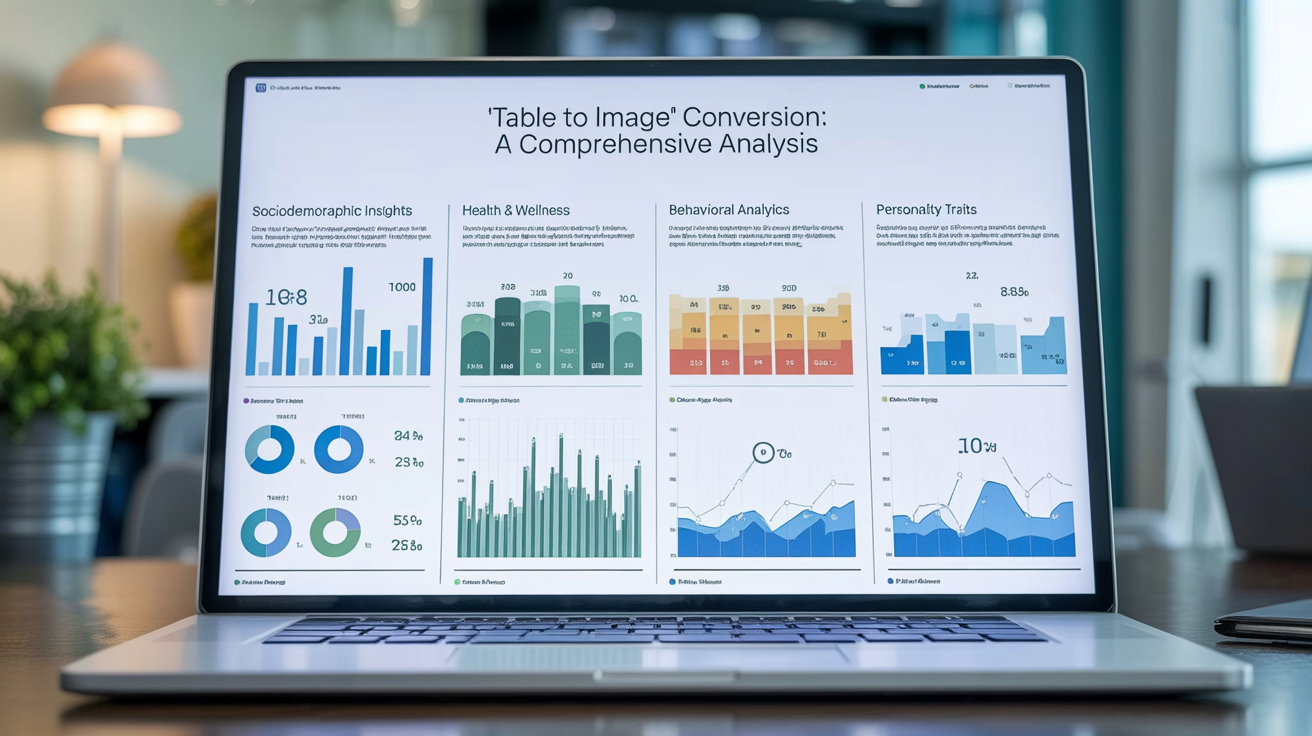
    With one click, the AI will analyze your table and your prompt to create a custom infographic based on your data.

  4. 4

    Download your graphic

    Your new, high-resolution infographic is ready to be downloaded as a PNG file and shared with the world.
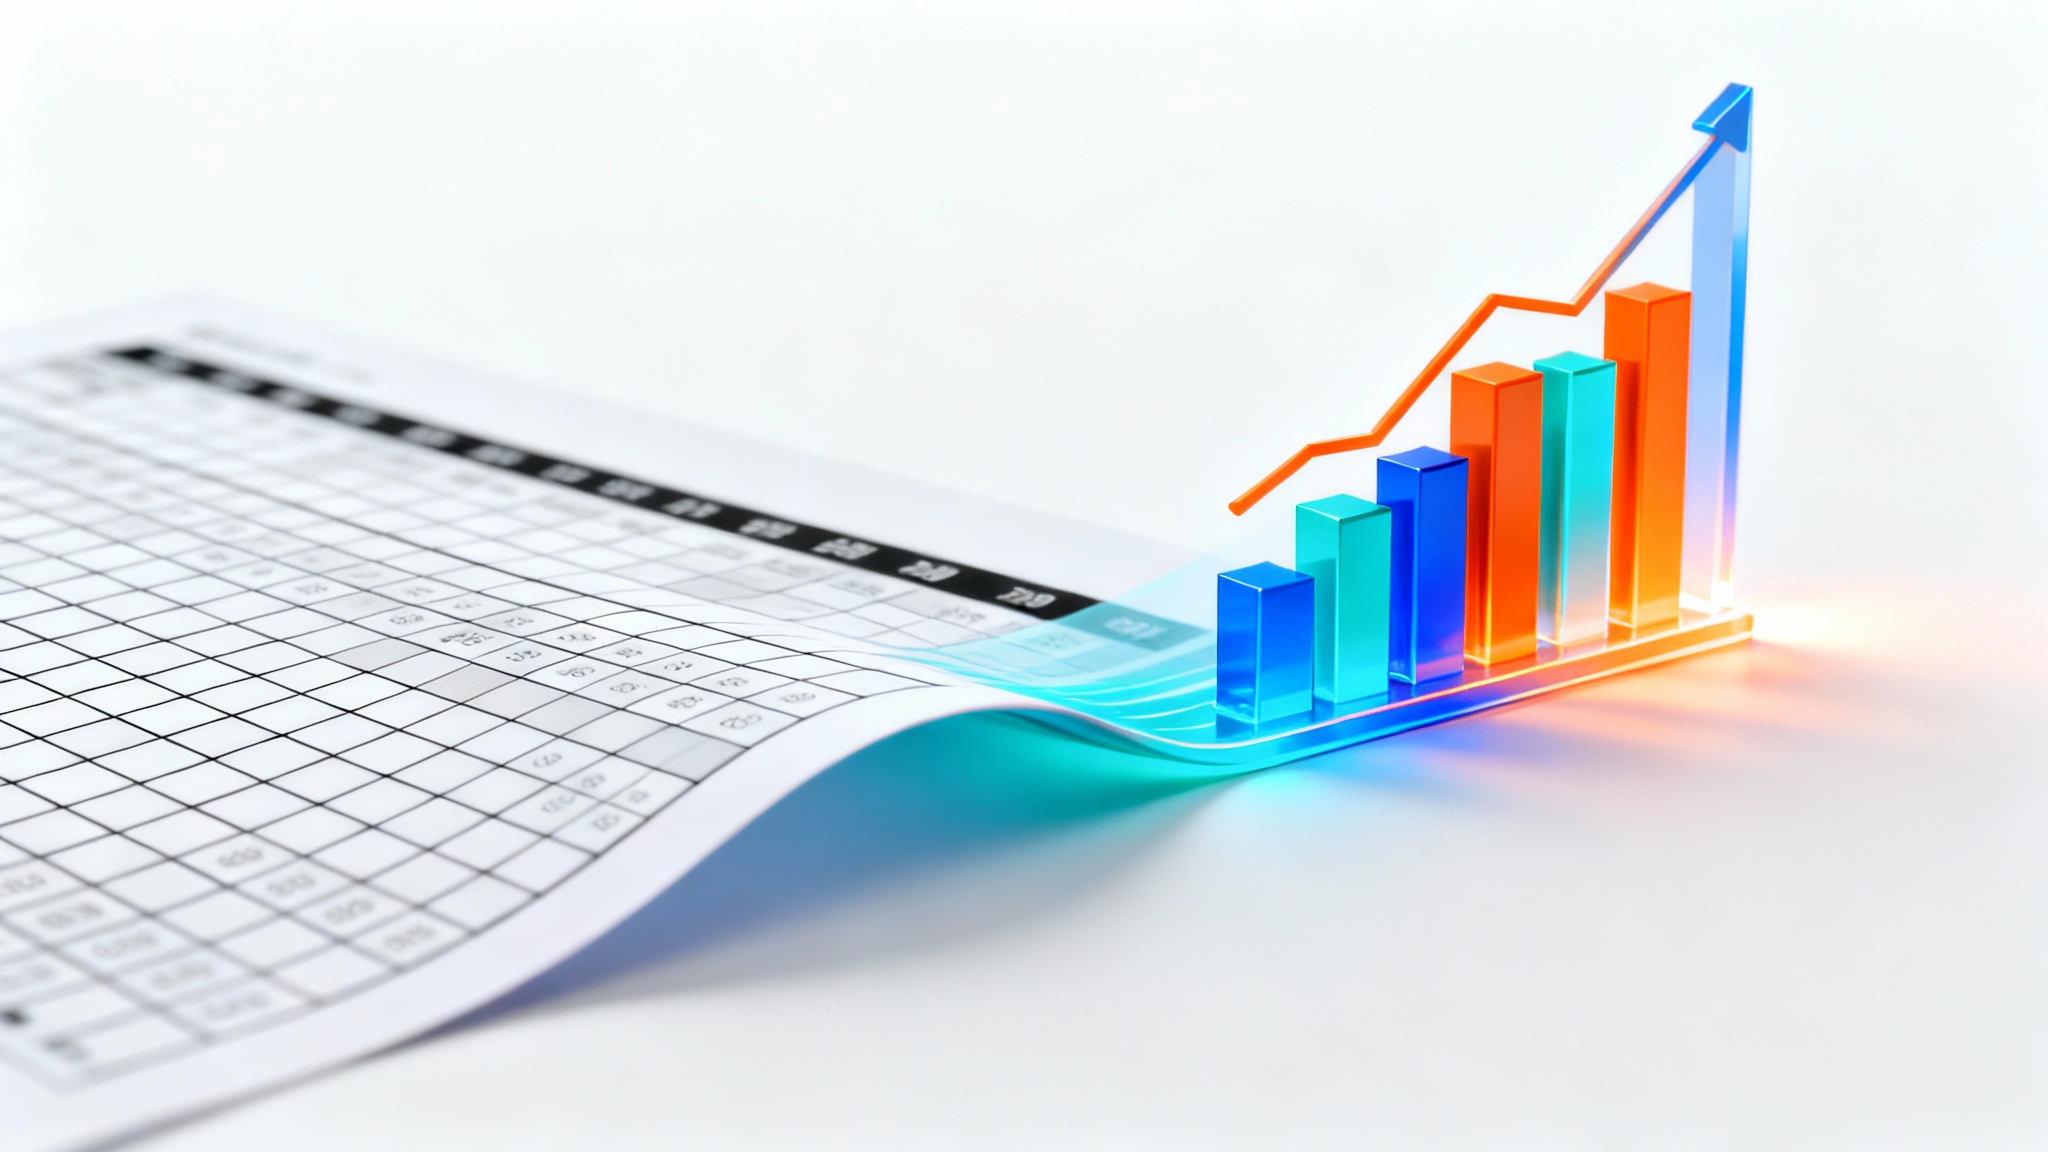
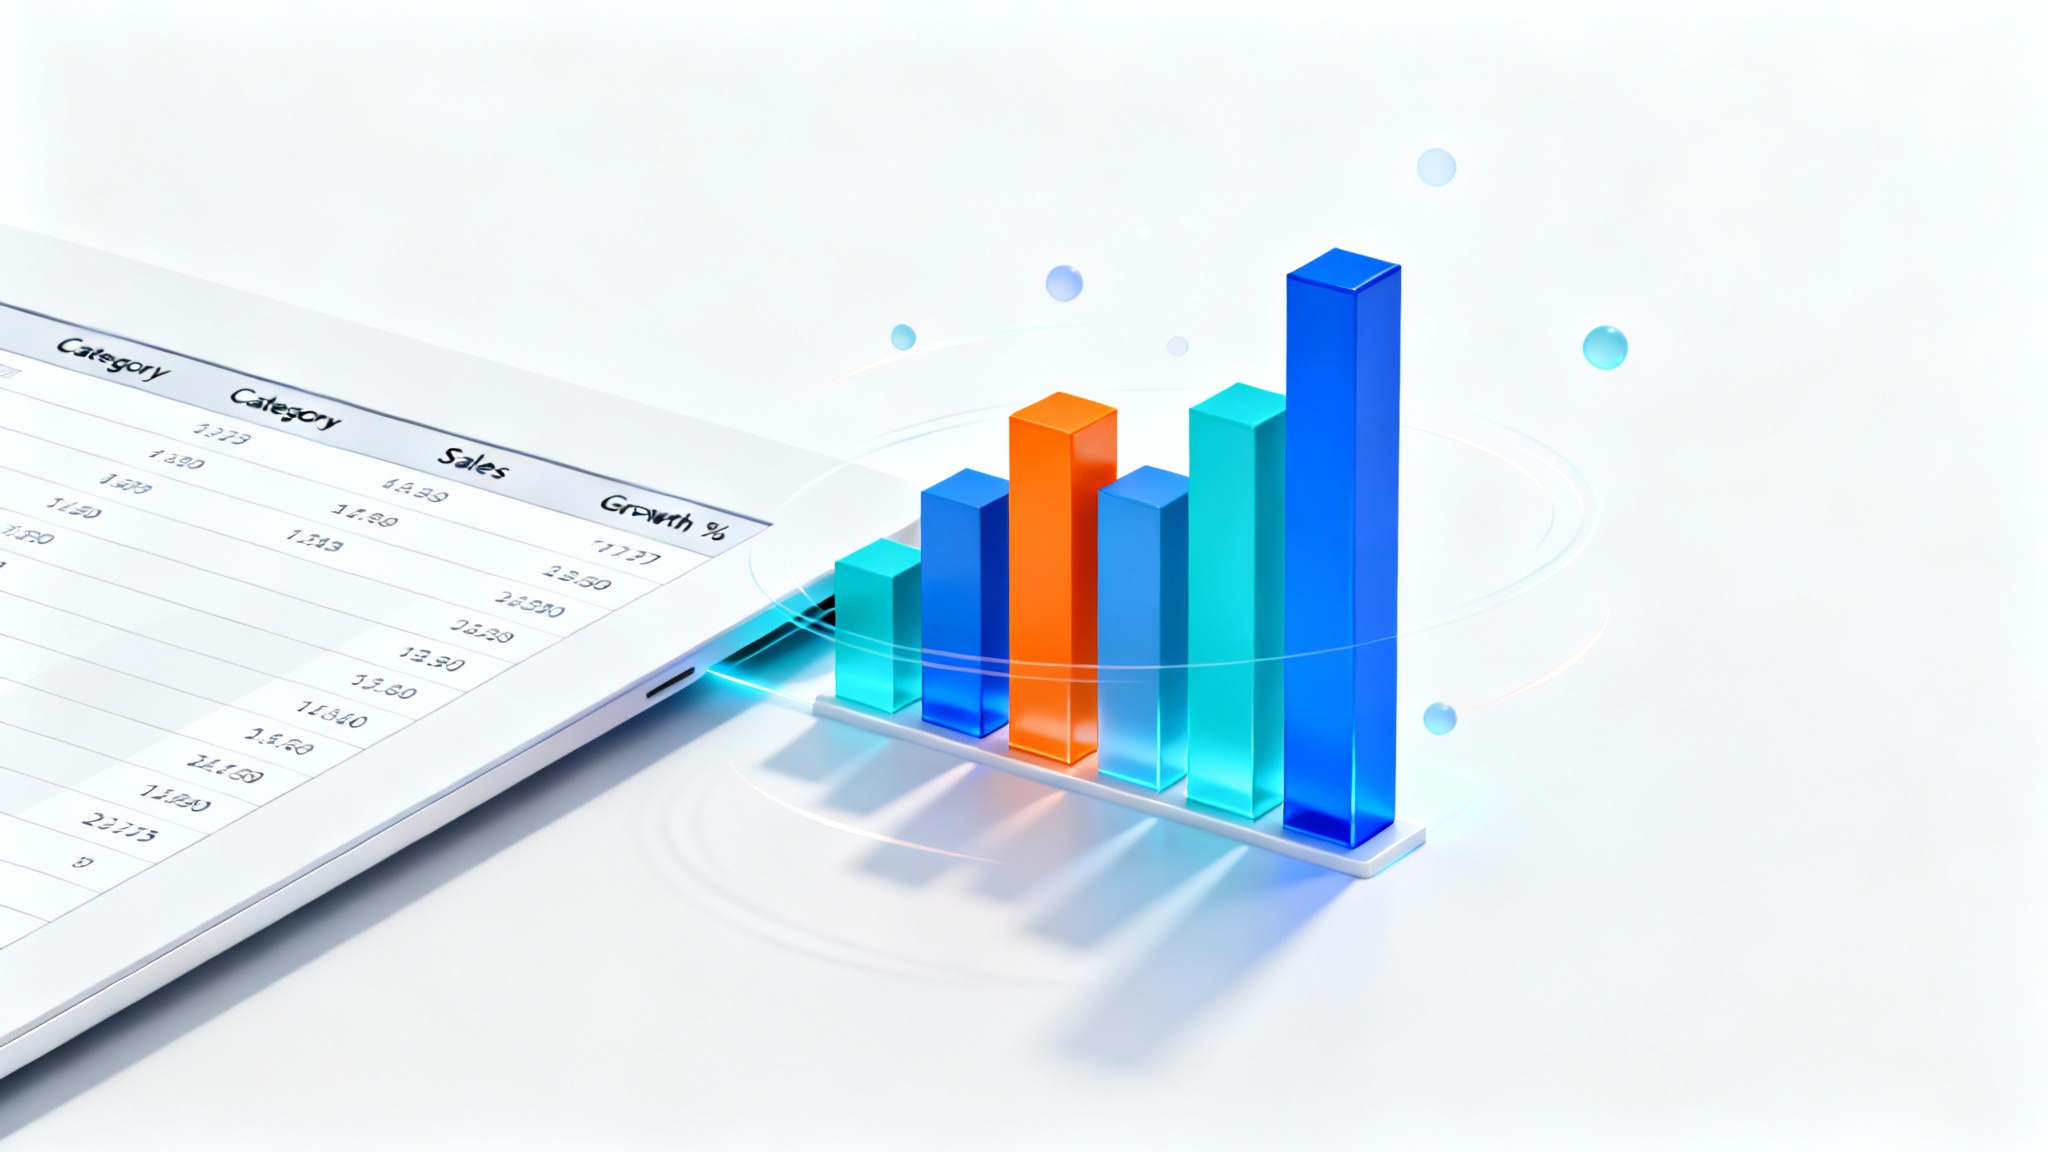
Transform dense spreadsheets and data tables into clear, compelling visuals without the manual effort. Simply upload an image of your table, and our AI will interpret the data for you. This process turns numbers and text into engaging graphics that make information easier to digest for any audience. Forget about complicated software; you can now generate a professional-looking infographic in seconds, making your data more accessible and impactful for reports, presentations, or social media posts.

Instantly Visualize Complex Data

A sleek, modern data table visualized as a high-quality image, shown against a clean white background. The table displays fictional sales data with clear headers and organized rows, illustrating the conversion of a table into a professional graphic.
You have complete creative direction over your final image. After uploading your table, tell our AI exactly how you want to visualize the information. You can specify chart types like bar graphs, pie charts, or line graphs for different data sets within your table. Request specific color palettes to match your brand or theme, and add icons to make your infographic even more dynamic. This conversational approach to design gives you the power of a graphic designer without needing the technical skills.

Guided Design with AI Prompts

A data table visually transforming into a vibrant, 3D infographic chart against a clean white background, illustrating the process of converting a table to an image.
Move beyond static tables that are difficult to share and view on different devices. Our tool converts your data into a single, high-resolution PNG image that is perfect for any platform. Embed your new infographic in a presentation, post it on your blog, or share it on social media to capture your audience's attention. Every download is crisp, clear, and ready to make an impact, ensuring your data looks professional wherever it’s displayed. Best of all, every download is watermark-free.

Shareable, High-Resolution Graphics

A digital data table being converted into a polished, high-quality image, shown on a clean white background.
It’s Fast: Go from a complex data table to a finished infographic in just a few clicks. It’s Intuitive: No need to learn complex data visualization software; just upload your table and type what you want to see. AI-Powered: Our AI intelligently analyzes your data and suggests the best ways to display it visually. Customizable: Fine-tune the final graphic by specifying colors, chart styles, and layouts with simple text commands. Improve Communication: Make your data more understandable and memorable for any audience.

Why use Pixelcut's AI Table to Image Converter?

An illustration showing a data table being transformed into a colorful 3D bar chart, symbolizing the conversion of data into a visual image.
Business Reports: Enhance quarterly reports and internal communications by turning performance metrics into clear visual summaries. Marketing Content: Create engaging infographics for social media campaigns, blog posts, and email newsletters to explain market trends or survey results. Academic Presentations: Make research findings more accessible and impactful by converting statistical tables into visual charts for posters and slideshows. Website Content: Improve user engagement by displaying data, like pricing comparisons or feature lists, in a visually appealing graphic format.

Table to Image Use Cases

A cleanly designed image of a modern data table showing fictional monthly business profits, illustrating the conversion of data into a high-quality graphic.

Frequently Asked Questions

Pixelcut is loved by over 2 million people

  • My favorite app

    Great app, easy to use. Helps our small business save time and money to create different marketing materials professionally. Thank you.
    Shaelyn D.
  • Best background remover

    I need a good background remover for my work and I've been through them all it feels like. This one is the best by far. It's so easy to use and the results always look amazing. Thank you Pixelcut!
    Kira H.
  • Love it

    It's amazingly easy and gives the perfect results for my bags and accessories. It looks like it was done by a professional photographer.
    Mary J.