My favorite app
Great app, easy to use. Helps our small business save time and money to create different marketing materials professionally. Thank you.
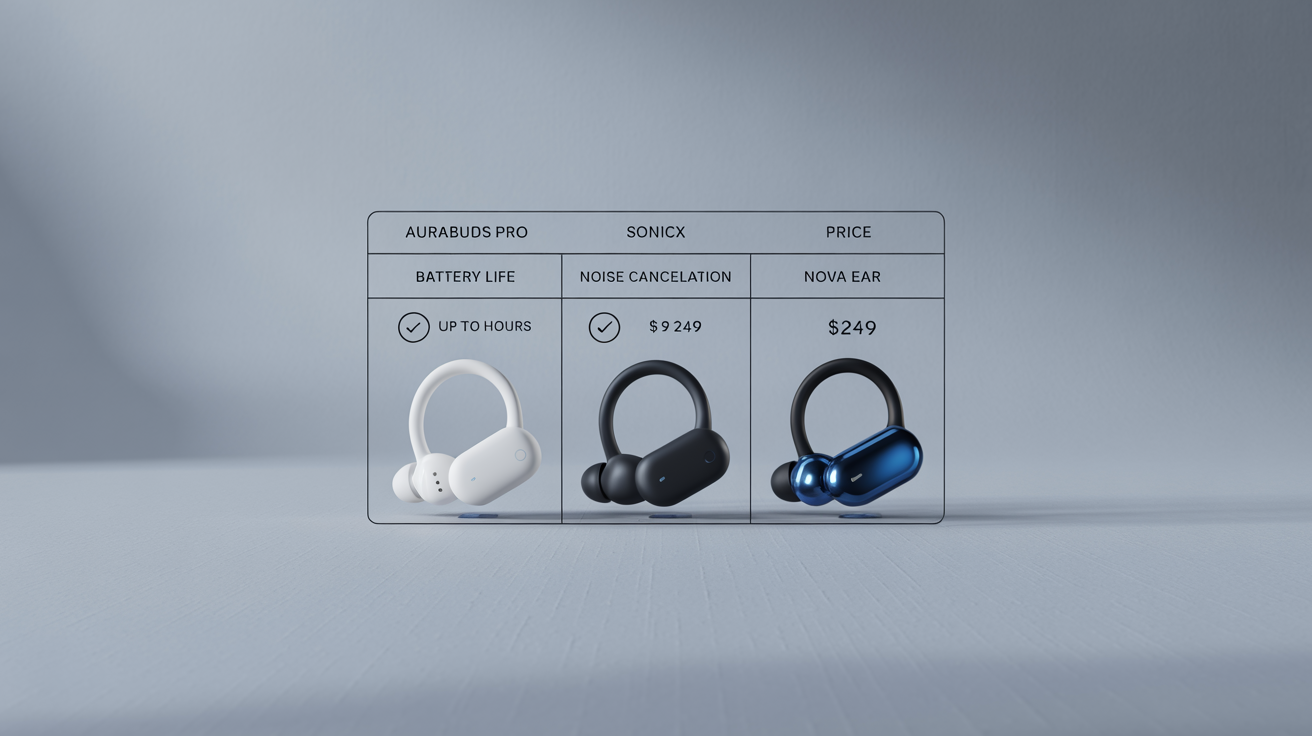
Write a detailed prompt. Include the earbud models and the features to compare (e.g., 'Chart comparing Pixel Buds Pro and Galaxy Buds 3 Pro on ANC, battery, and call quality').
With one click, the AI will interpret your prompt and create a custom infographic that visually represents the comparison you described.
Your high-resolution comparison chart is ready to be downloaded as a PNG. Use it to help with your purchasing decision or share it in your content.
Simply write a text prompt describing the chart you want. Include the names of the earbud models and the specific features you want to compare, such as battery life, active noise cancellation, price, or fit. The AI will then generate a visual chart based on your description.
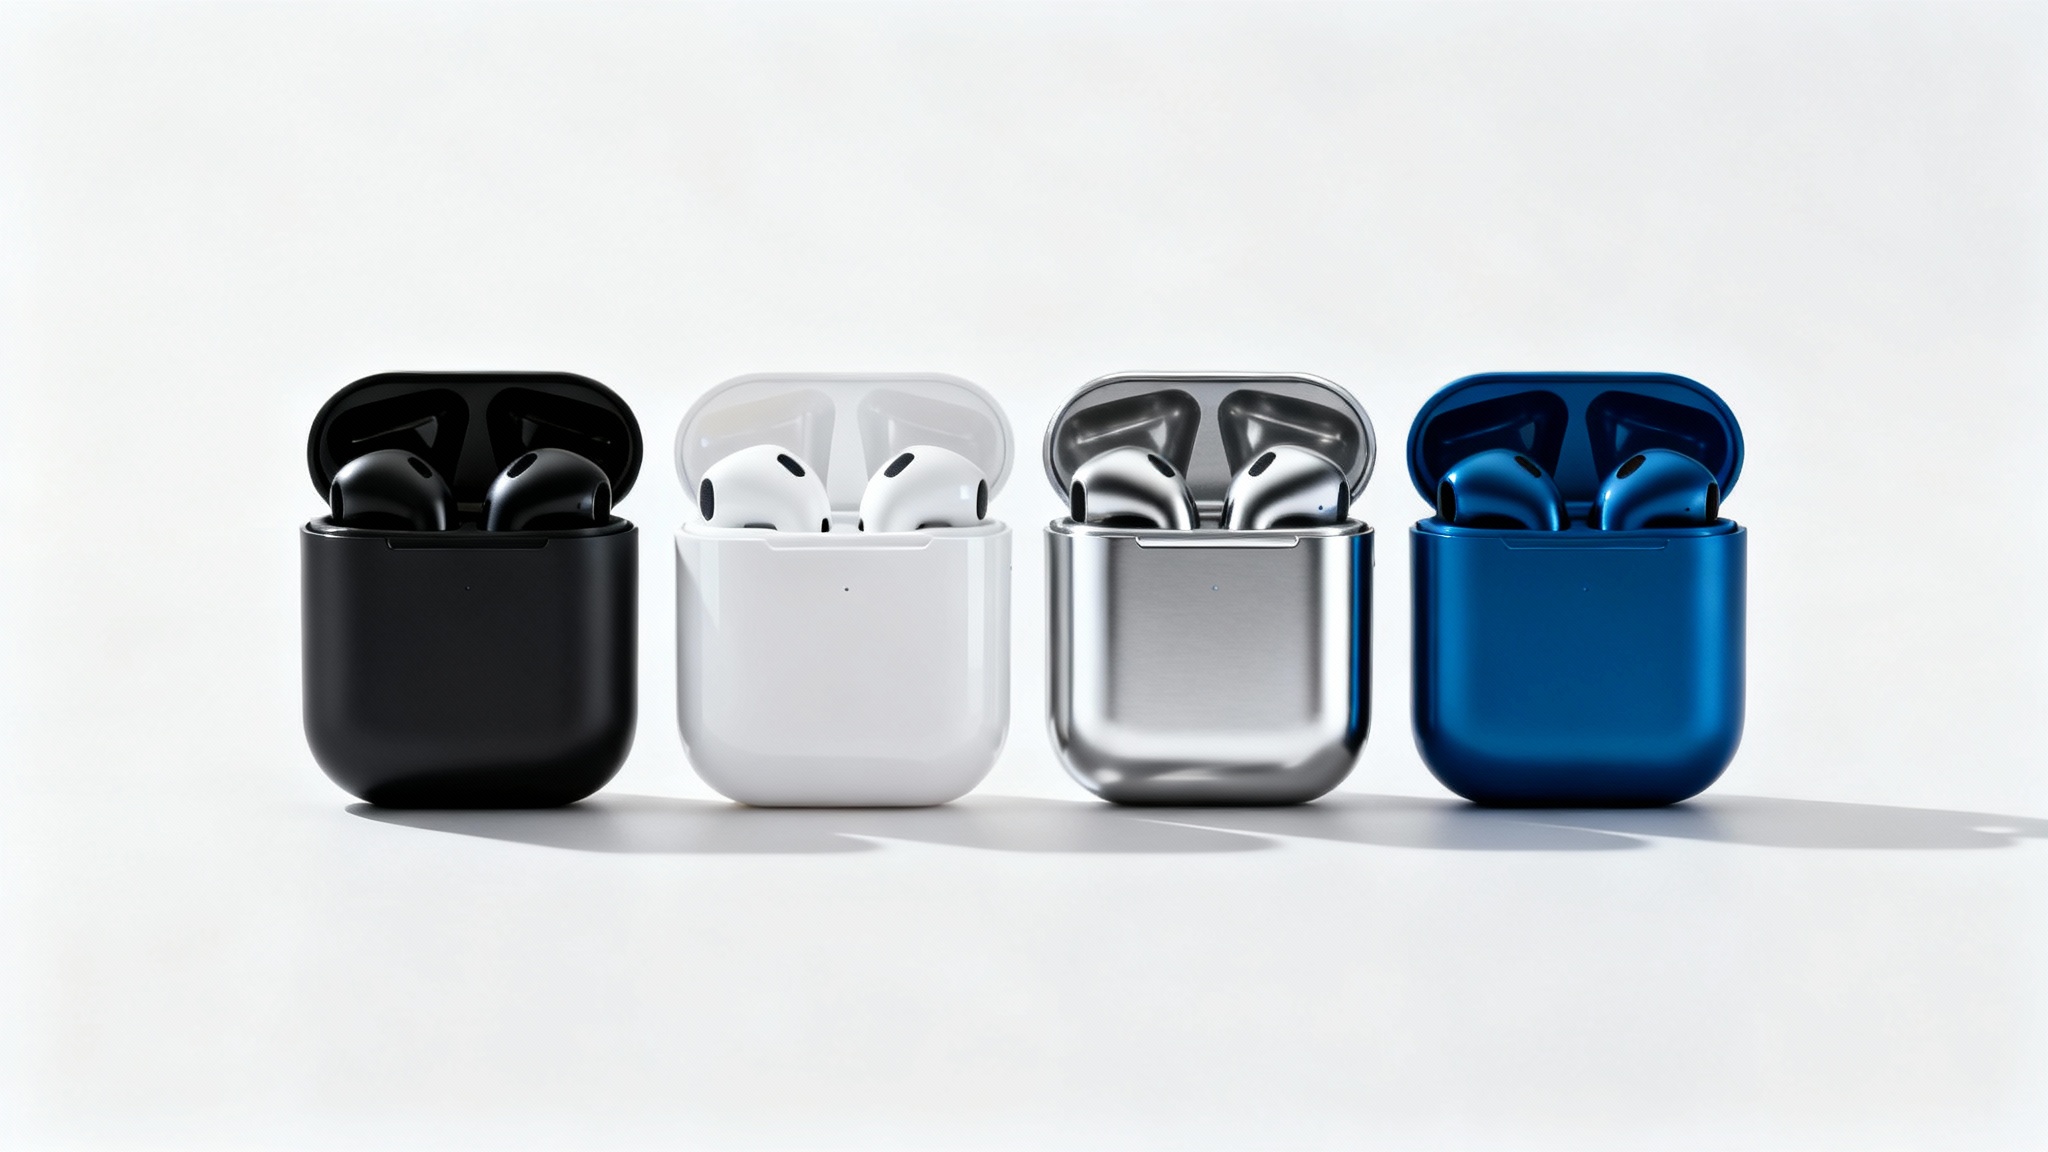
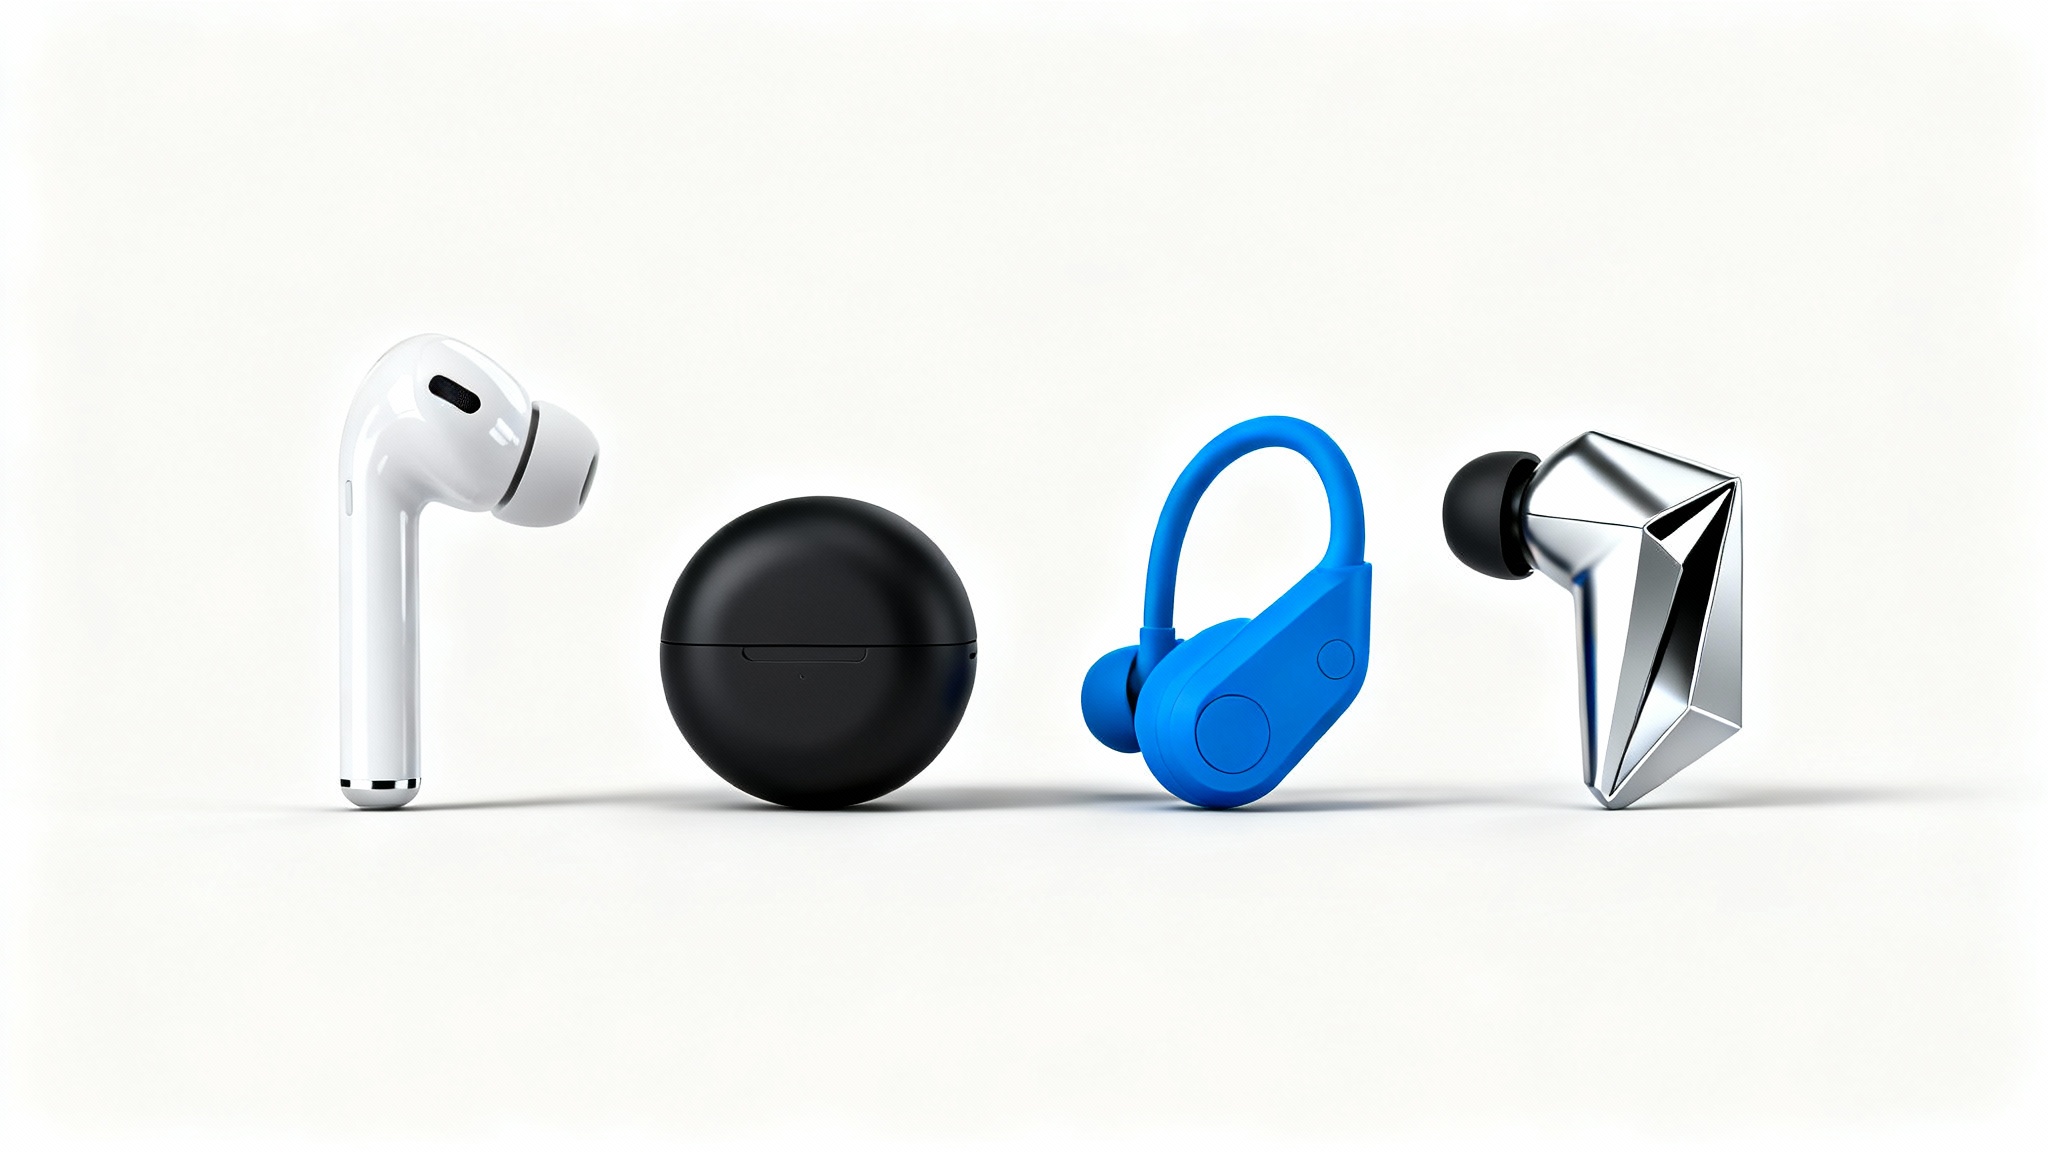
Yes, you can compare any models you like. Just include their names in the prompt, for example, 'Apple AirPods Pro 3 vs. Bose QuietComfort Ultra Earbuds.' You provide the information to be visualized.
The AI generates a visual chart based on the text you provide in the prompt. You are responsible for inputting the features and specifications you want to see compared. The tool visualizes the data you give it; it does not pull real-time product data.
Commonly compared features include sound quality, active noise cancellation (ANC), battery life, comfort and fit, microphone quality for calls, and price. You can also compare specifics like water resistance (IP rating), Bluetooth codecs (like AAC or aptX), and charging case features.
Yes, you can download your generated comparison chart as a high-resolution PNG file. These images are ideal for use in blog posts, articles, social media updates, or presentations to make your content more visually appealing and informative.
While the primary way to create a chart is through a text description, you can also upload an image to give the AI a visual reference for the style you're aiming for. For the best results, clearly describe the models and features in your text prompt.
Great app, easy to use. Helps our small business save time and money to create different marketing materials professionally. Thank you.
I need a good background remover for my work and I've been through them all it feels like. This one is the best by far. It's so easy to use and the results always look amazing. Thank you Pixelcut!
It's amazingly easy and gives the perfect results for my bags and accessories. It looks like it was done by a professional photographer.