My favorite app
Great app, easy to use. Helps our small business save time and money to create different marketing materials professionally. Thank you.
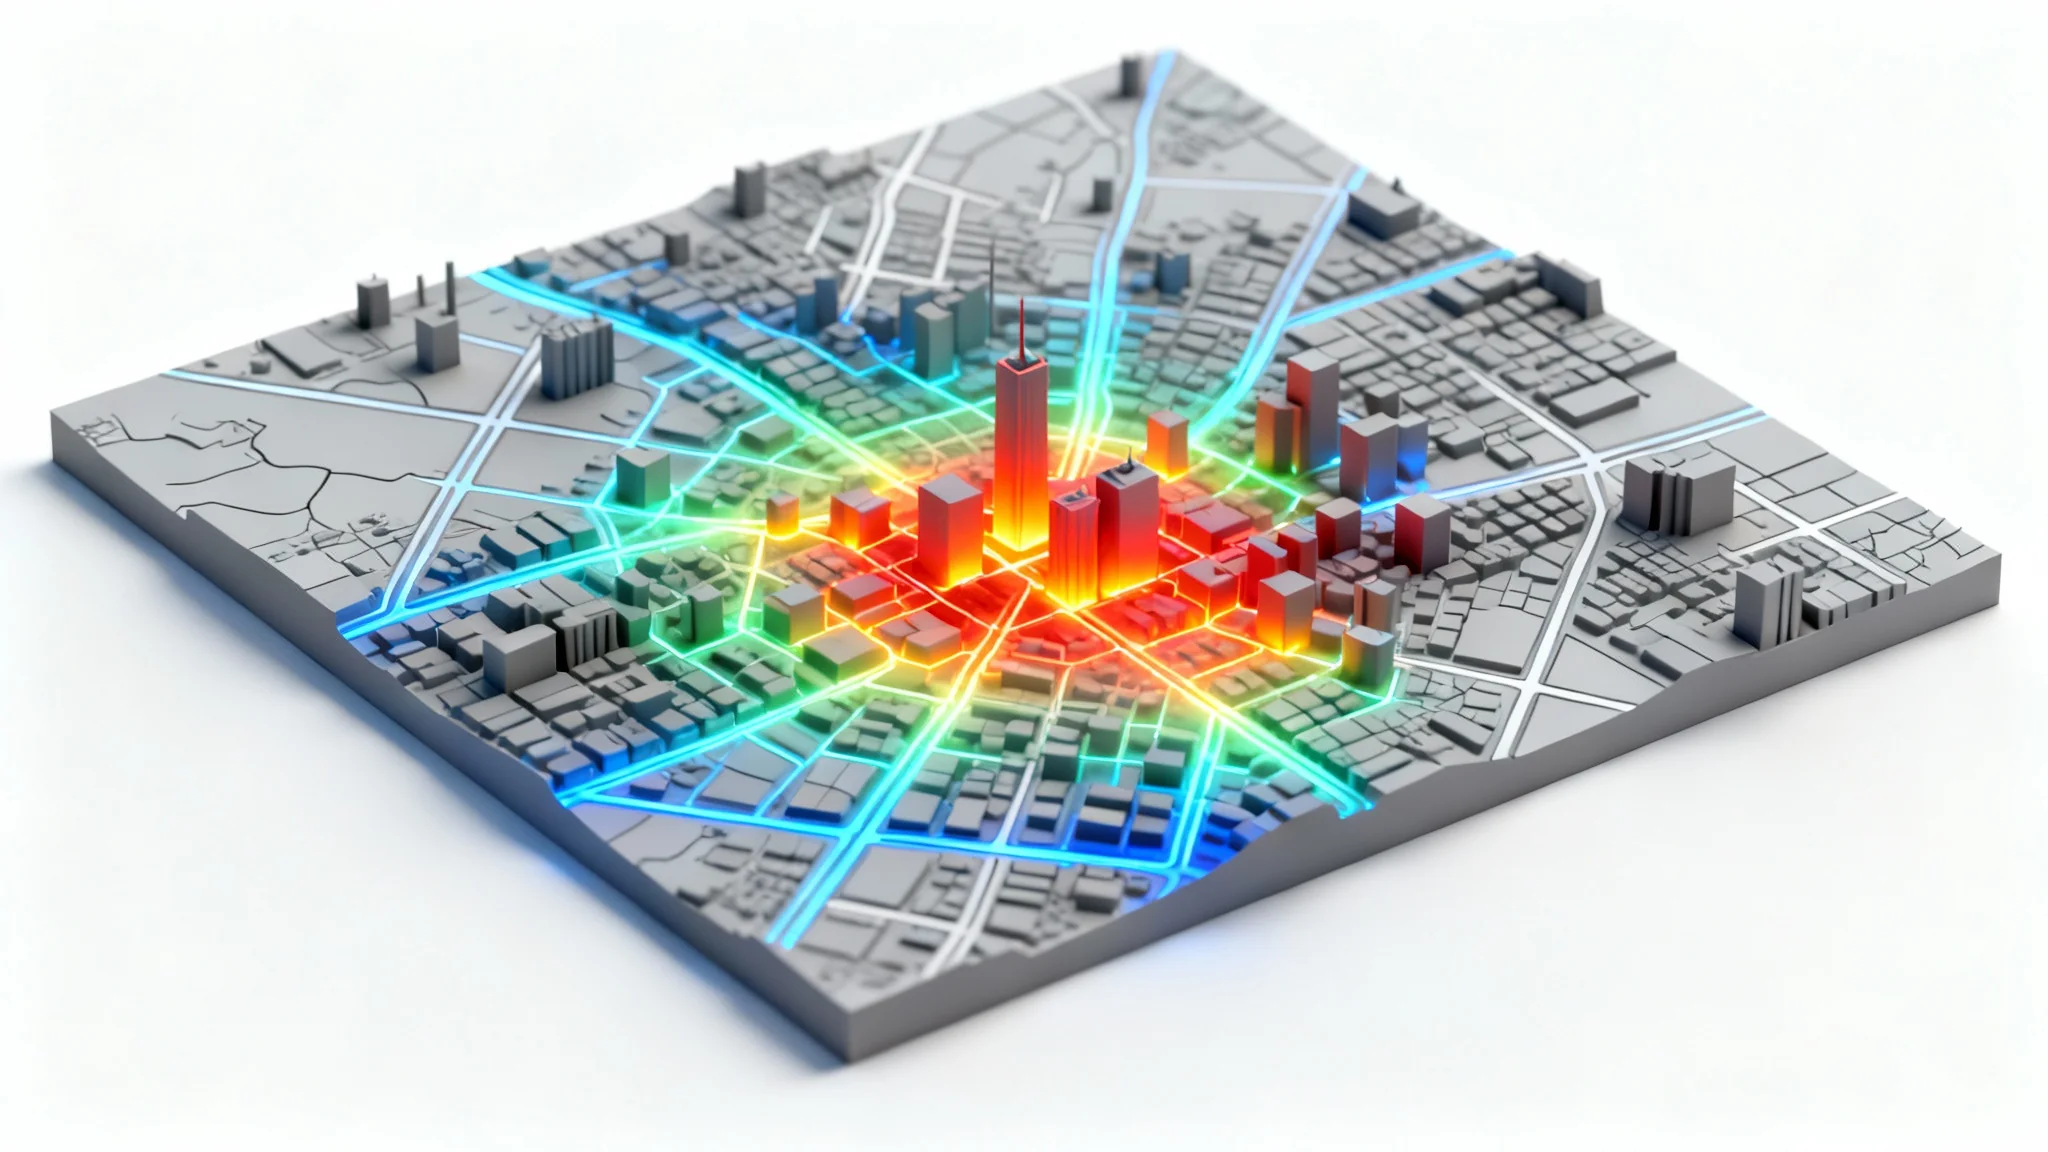
Start by uploading the base image you want to analyze. This could be a screenshot, map, or floor plan.
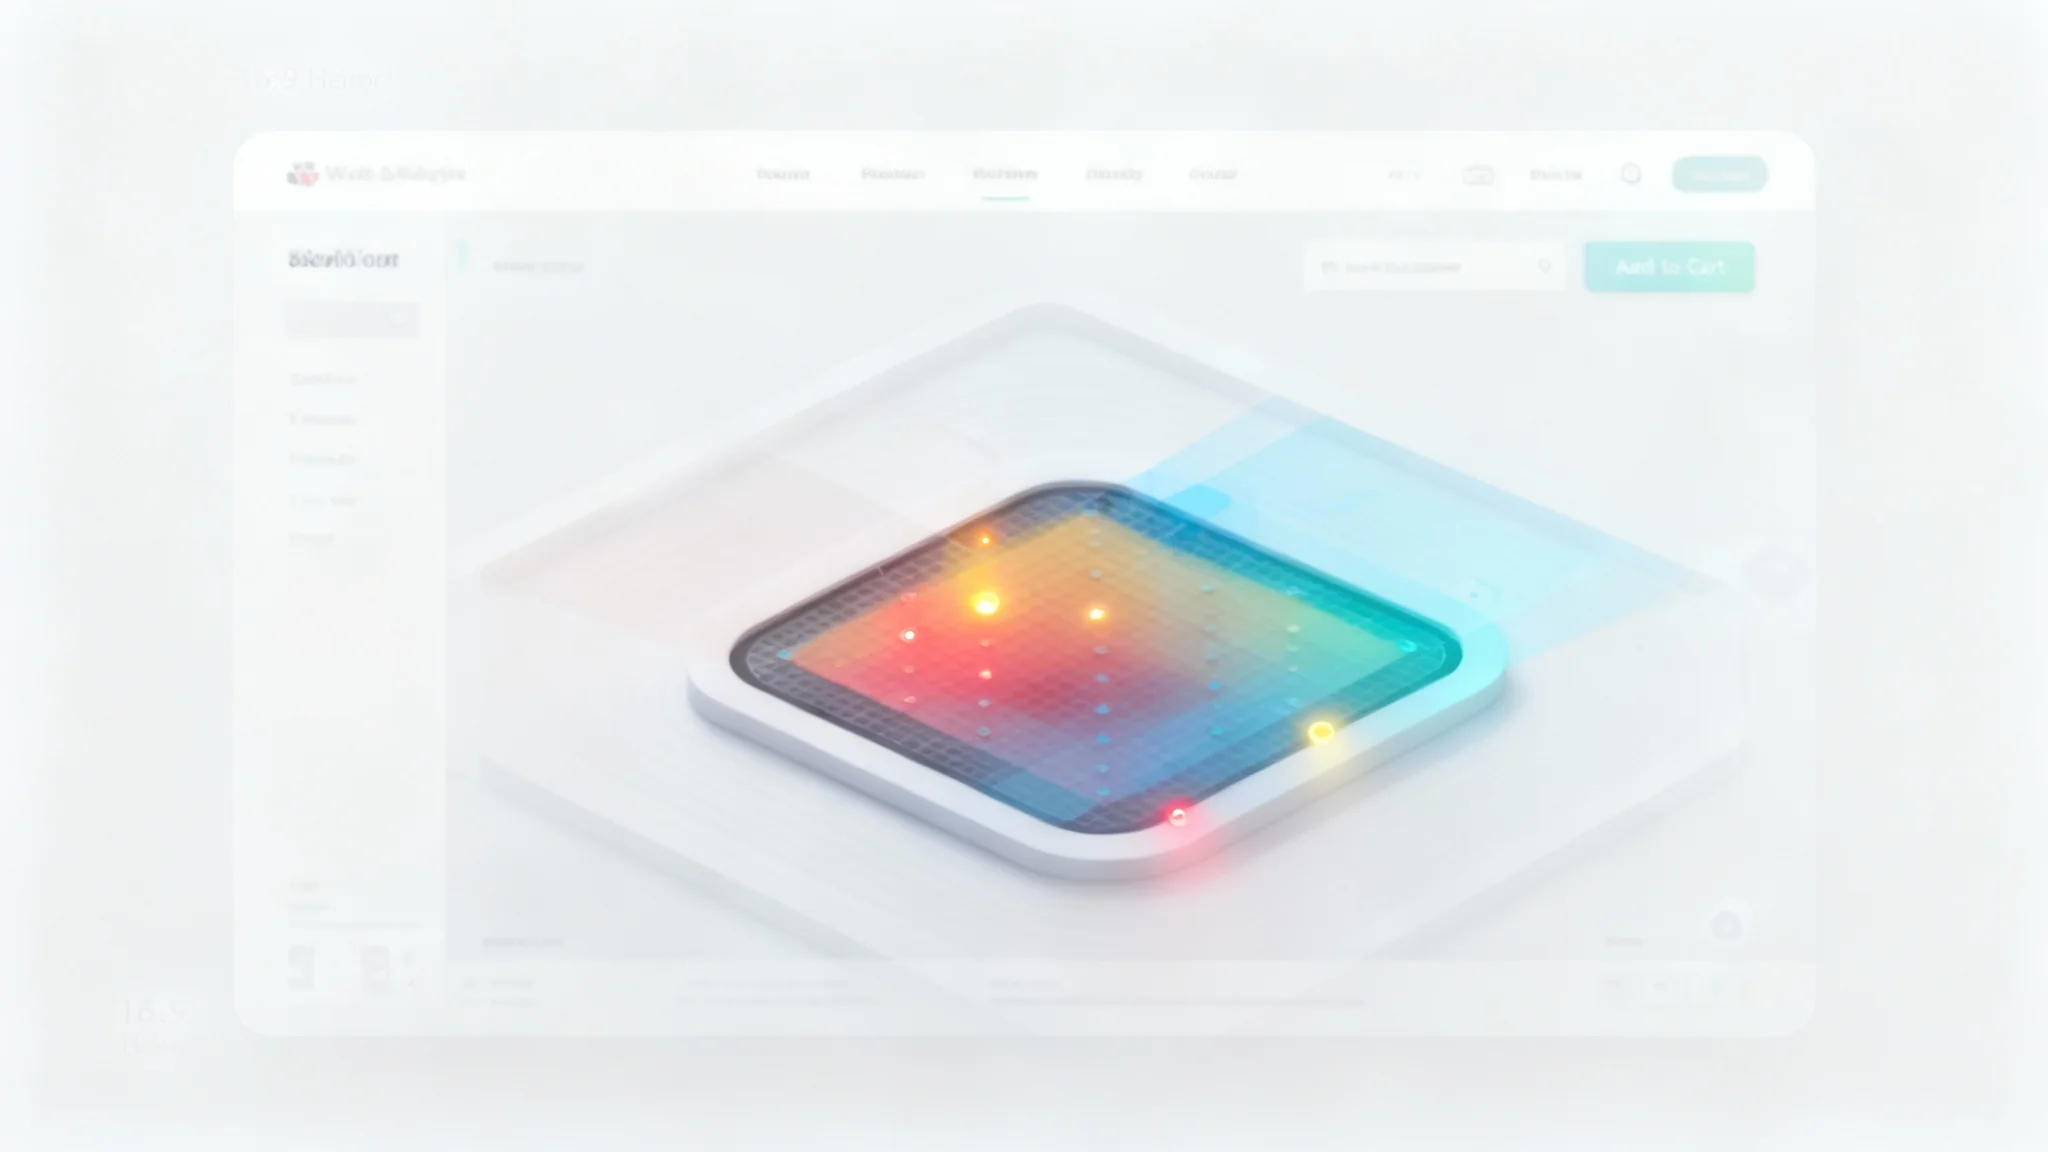
In the text prompt, explain where the areas of high and low activity are. For example, 'Show high activity in red on the main buttons.'
Click the generate button. Our AI will create a colorful heat map overlay on your image based on your description.
Your high-resolution heat map image is ready to be downloaded. Use it in your presentations, reports, or analysis.
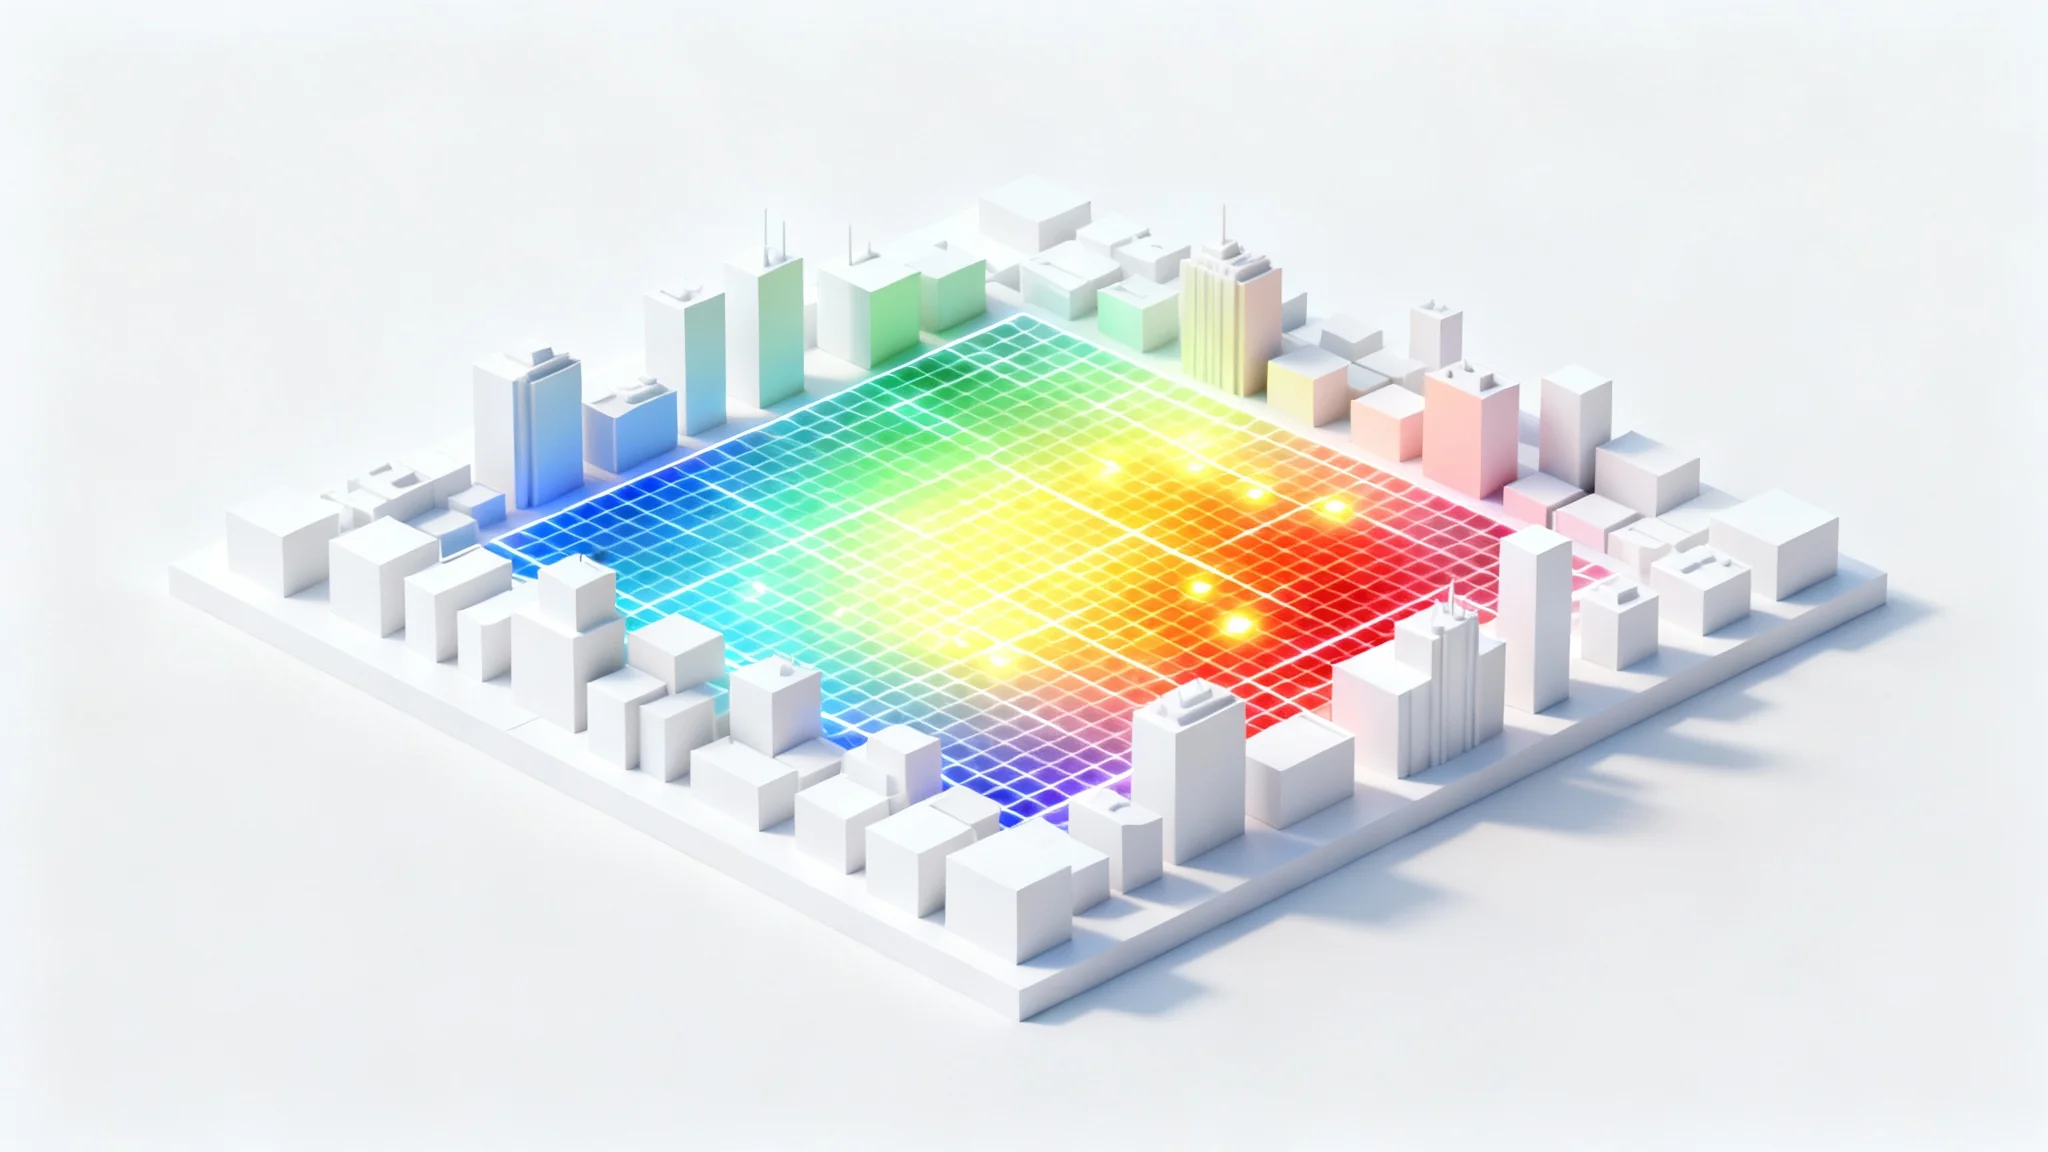
An AI heat map generator is a tool that uses artificial intelligence to create a visual representation of data on top of an image you provide. You simply upload a base image (like a map or screenshot) and use text to describe where you want to see areas of high and low activity. The AI then generates a color-coded heat map for you.
You can upload a wide variety of images to serve as the base for your heat map. Common examples include website and app screenshots, architectural floor plans, retail store layouts, geographic maps, and marketing materials.
No, you don't need to upload a spreadsheet or data file. Our AI-powered tool works by interpreting your text descriptions. You just need to tell the AI where to place the 'hot' and 'cold' spots and how they should look.
Yes. You can specify the color gradient in your text prompt. For example, you could ask for a traditional heat map ranging from red to blue, or you could request a custom color scheme that matches your brand's style.
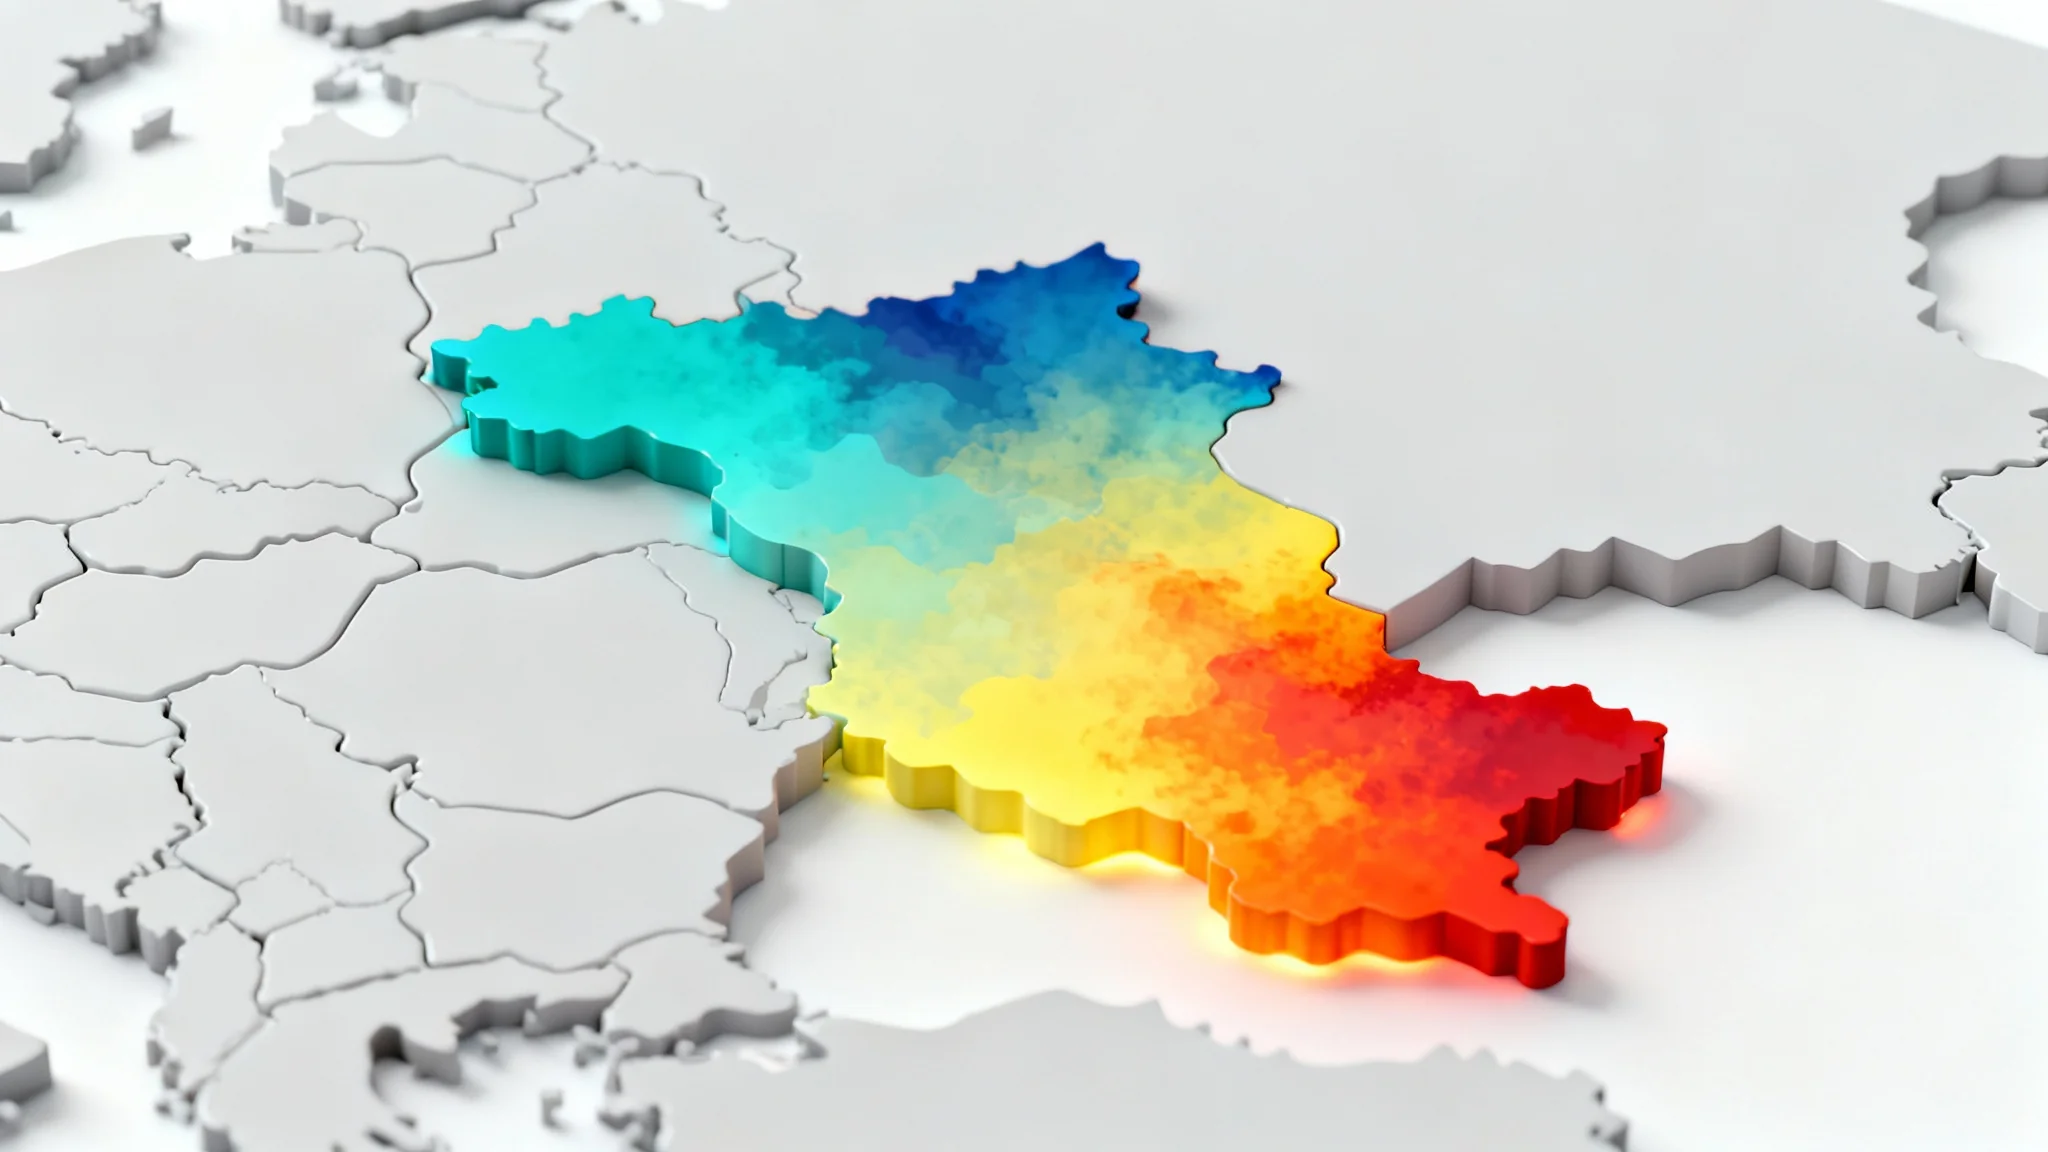
Businesses use heat maps to visualize data and simplify analysis. They are commonly used to understand website user behavior, optimize retail layouts, analyze geographic trends, and evaluate the effectiveness of marketing designs.
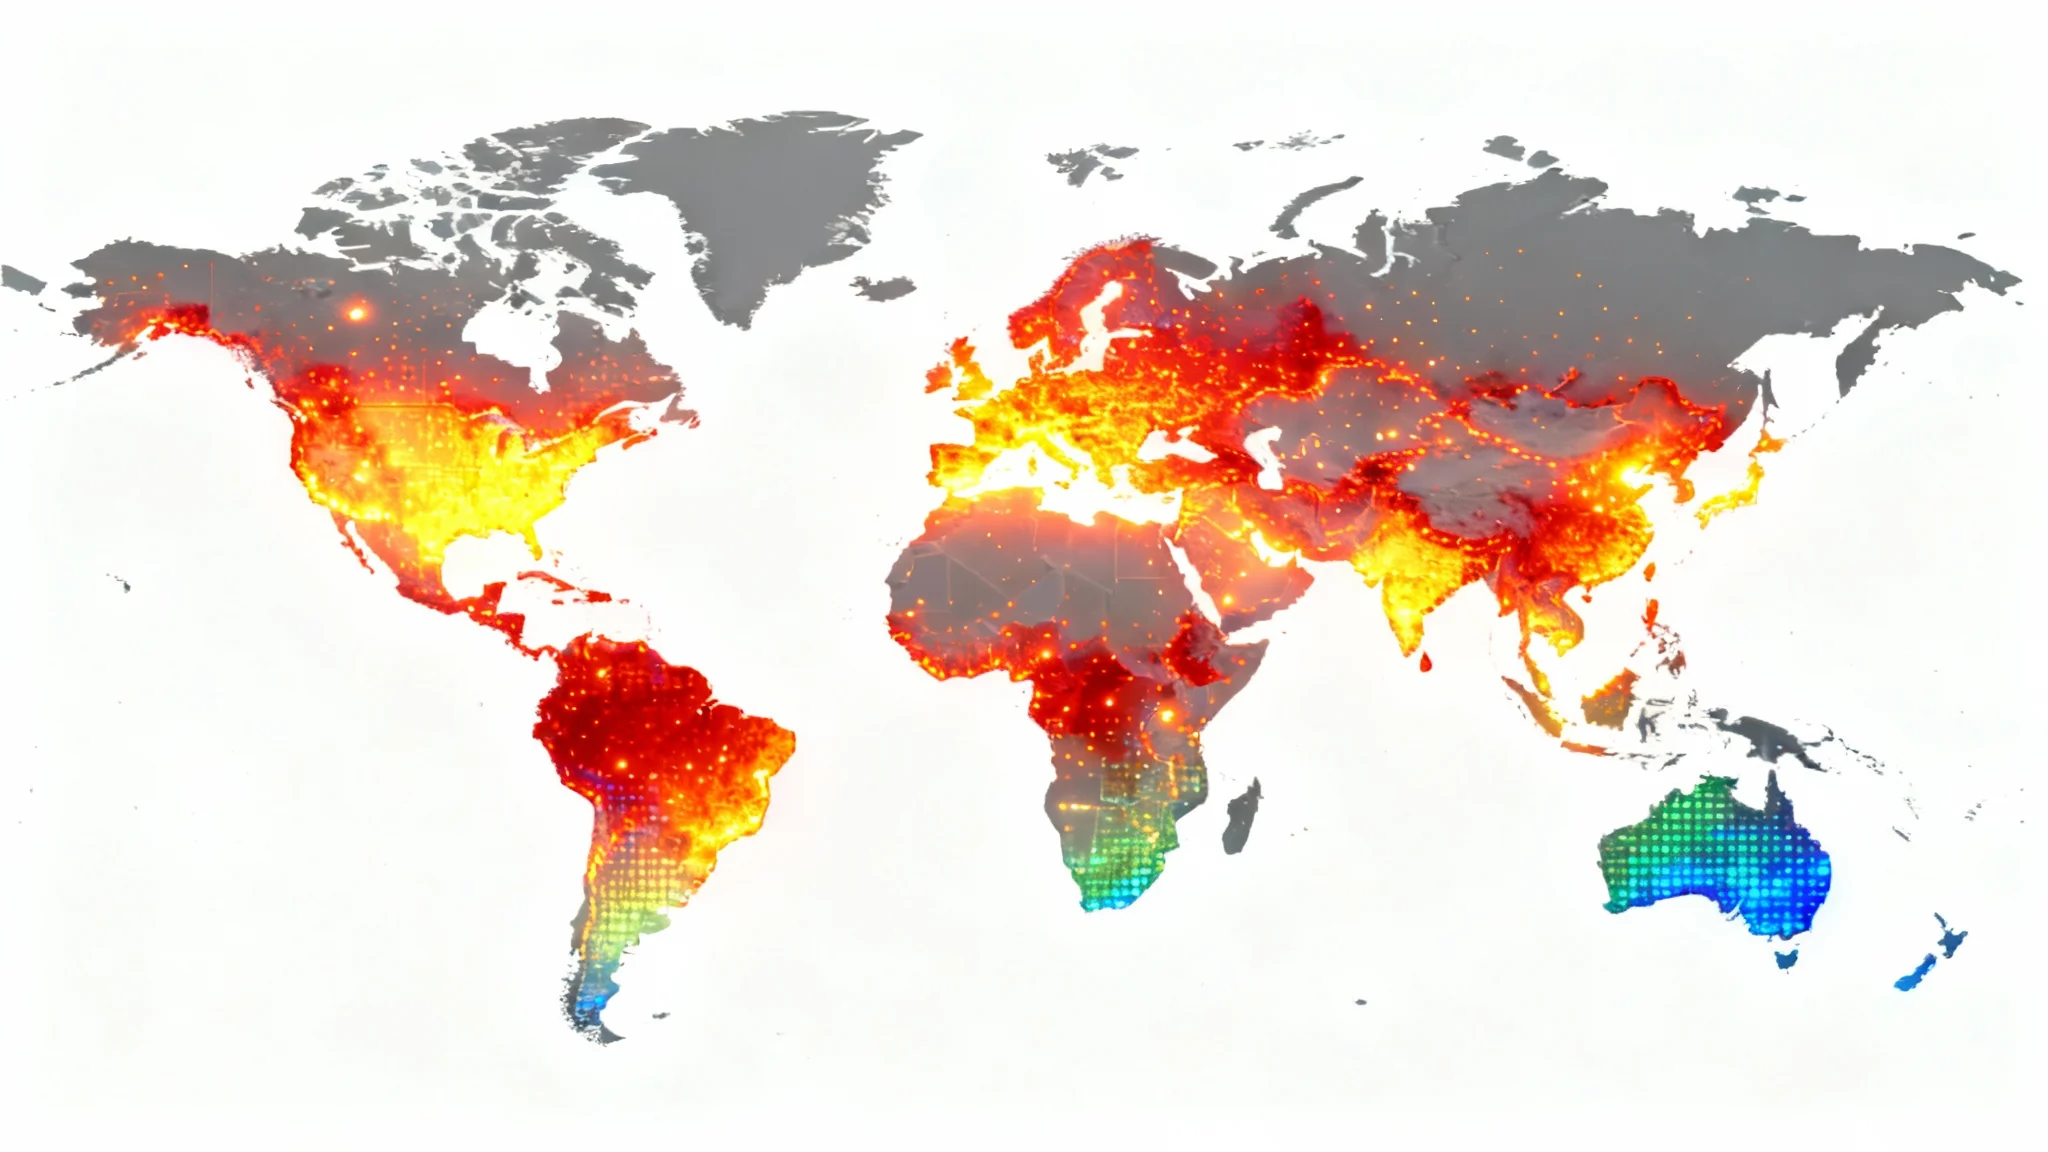
A geographic heat map shows data density over a geographical area, like population or sales per region. A website heat map shows user interaction on a webpage, such as where they click, scroll, or move their mouse. Our tool can help you create a visual representation of either type.
Great app, easy to use. Helps our small business save time and money to create different marketing materials professionally. Thank you.
I need a good background remover for my work and I've been through them all it feels like. This one is the best by far. It's so easy to use and the results always look amazing. Thank you Pixelcut!
It's amazingly easy and gives the perfect results for my bags and accessories. It looks like it was done by a professional photographer.