My favorite app
Great app, easy to use. Helps our small business save time and money to create different marketing materials professionally. Thank you.
Start by uploading an image. This can be a rough sketch of your research flow, a similar diagram you like, or a document with your methodology.
In the text prompt, explain the methodology diagram you want. Include steps like 'data collection,' 'analysis,' and the flow between them.
Click the generate button. Our AI will interpret your prompt and create a professional methodology diagram for your research.
Your high-resolution methodology diagram is ready to be downloaded. Use it in your research papers, presentations, or proposals.
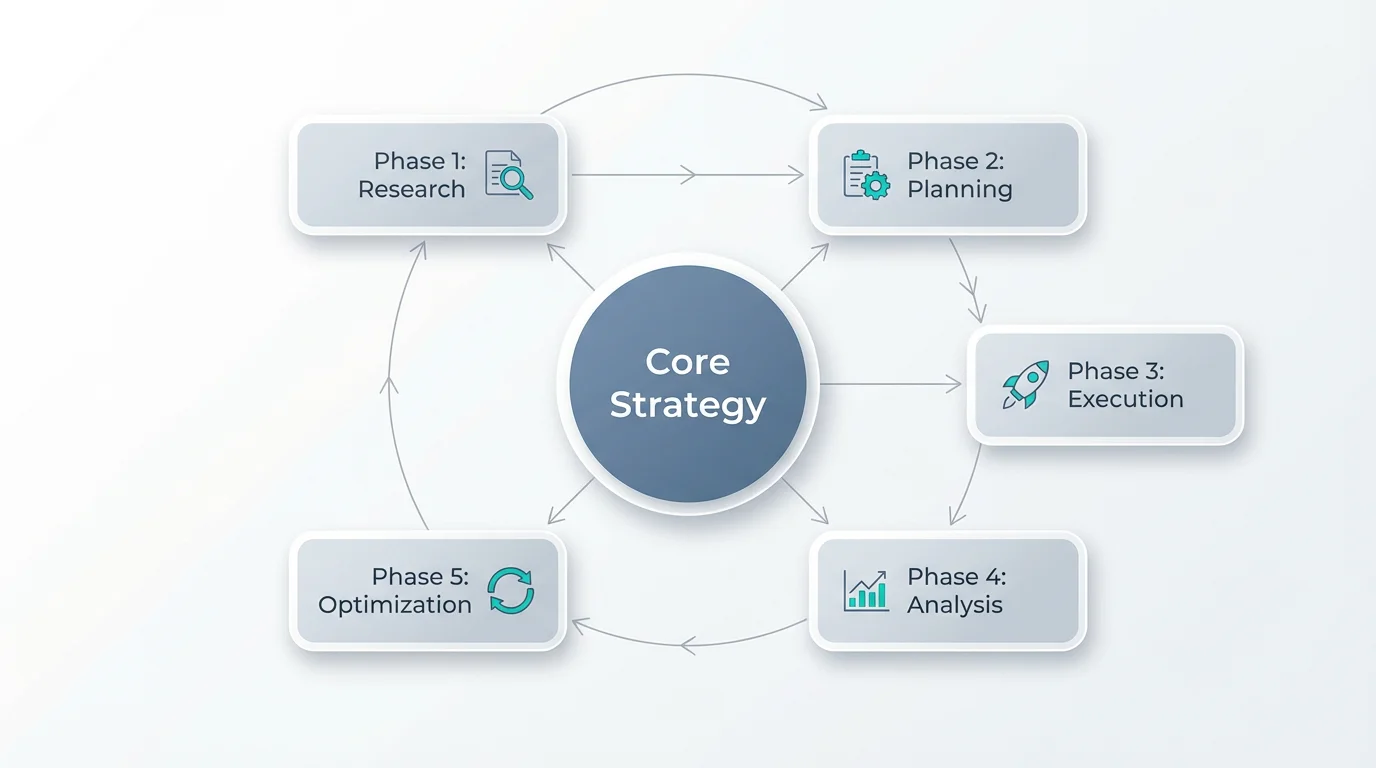
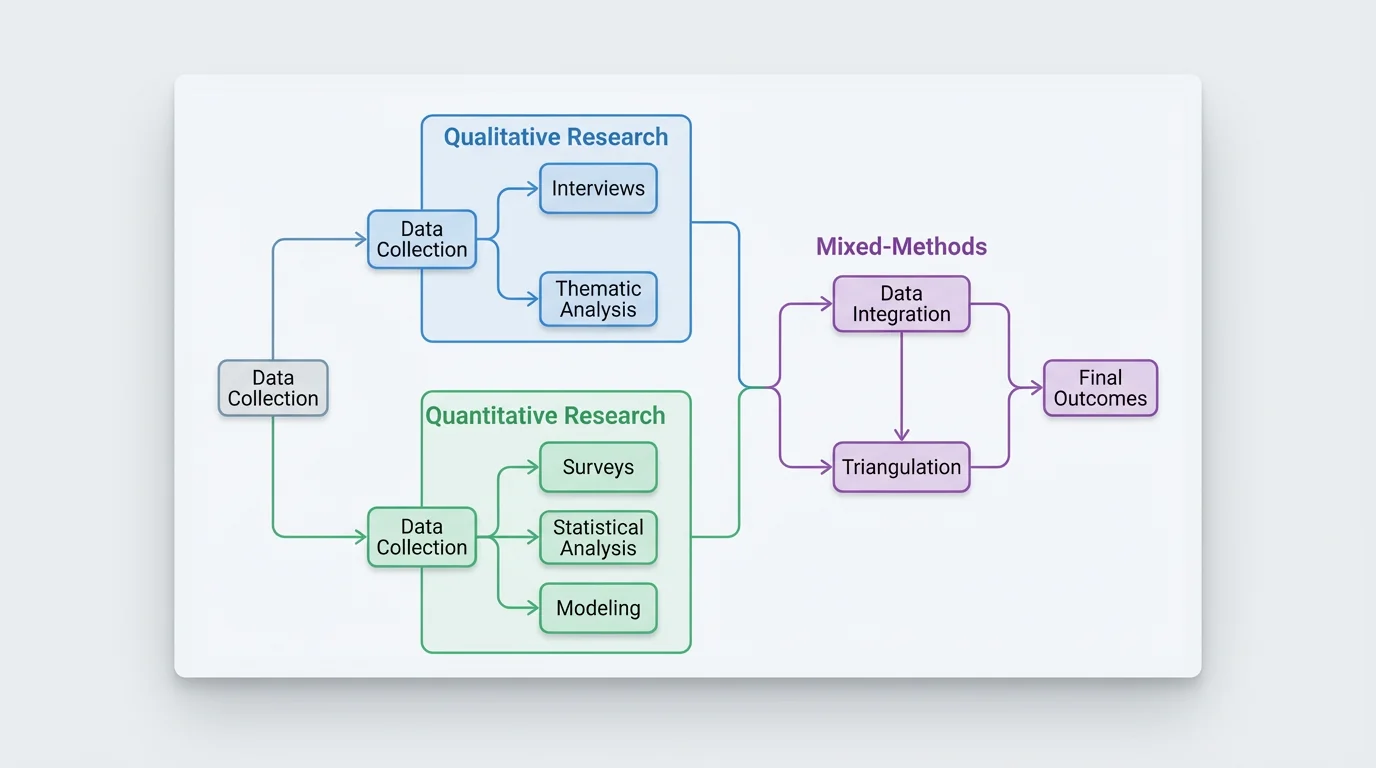
A methodology diagram, or research methodology flowchart, is a visual representation of the steps involved in conducting a study. It maps out the entire research process, from identifying the problem and formulating questions to data collection, analysis, and interpretation of the findings.
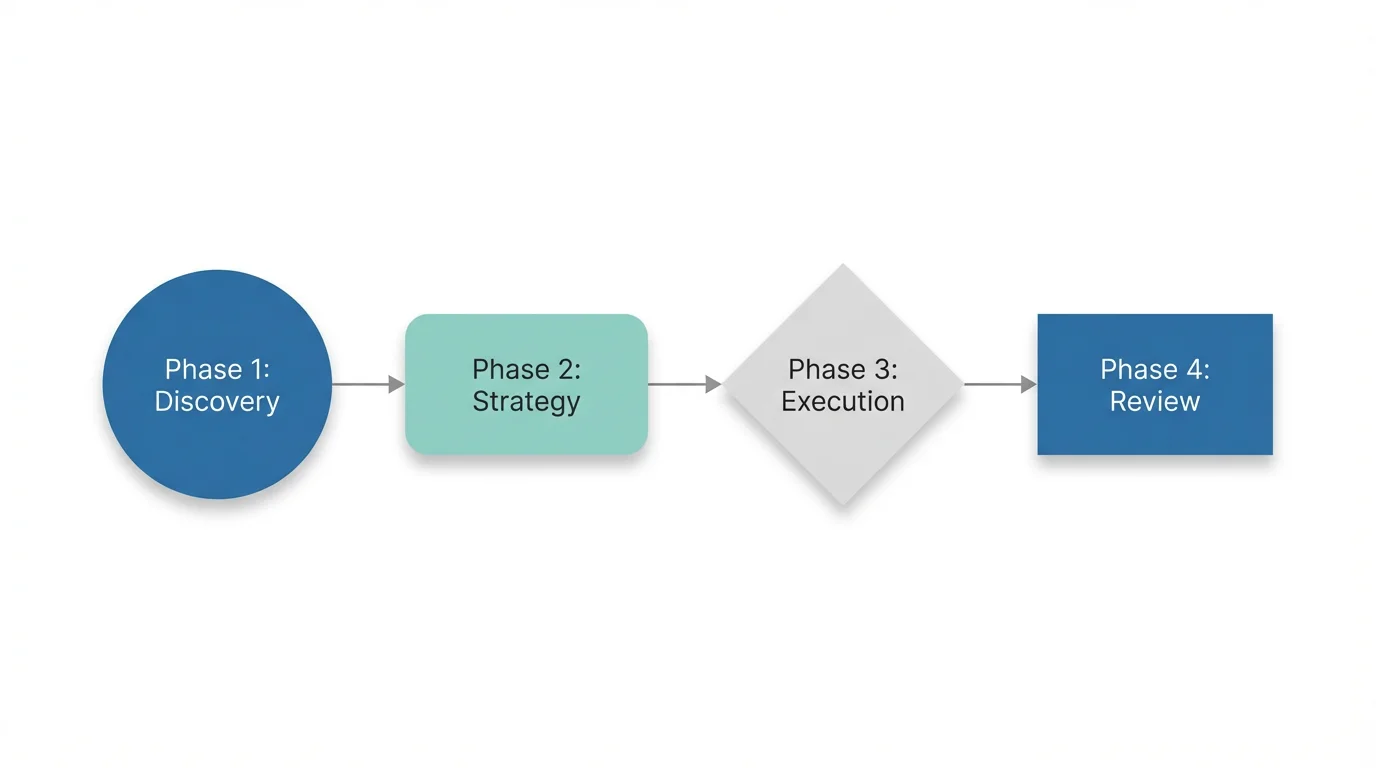
First, upload an optional reference image or a rough sketch of your research flow. Then, type a text prompt describing the diagram you want to create. Specify the research stages, the direction of flow, the methodologies involved (like qualitative or quantitative), and any color preferences. The AI will then generate a diagram based on your description.
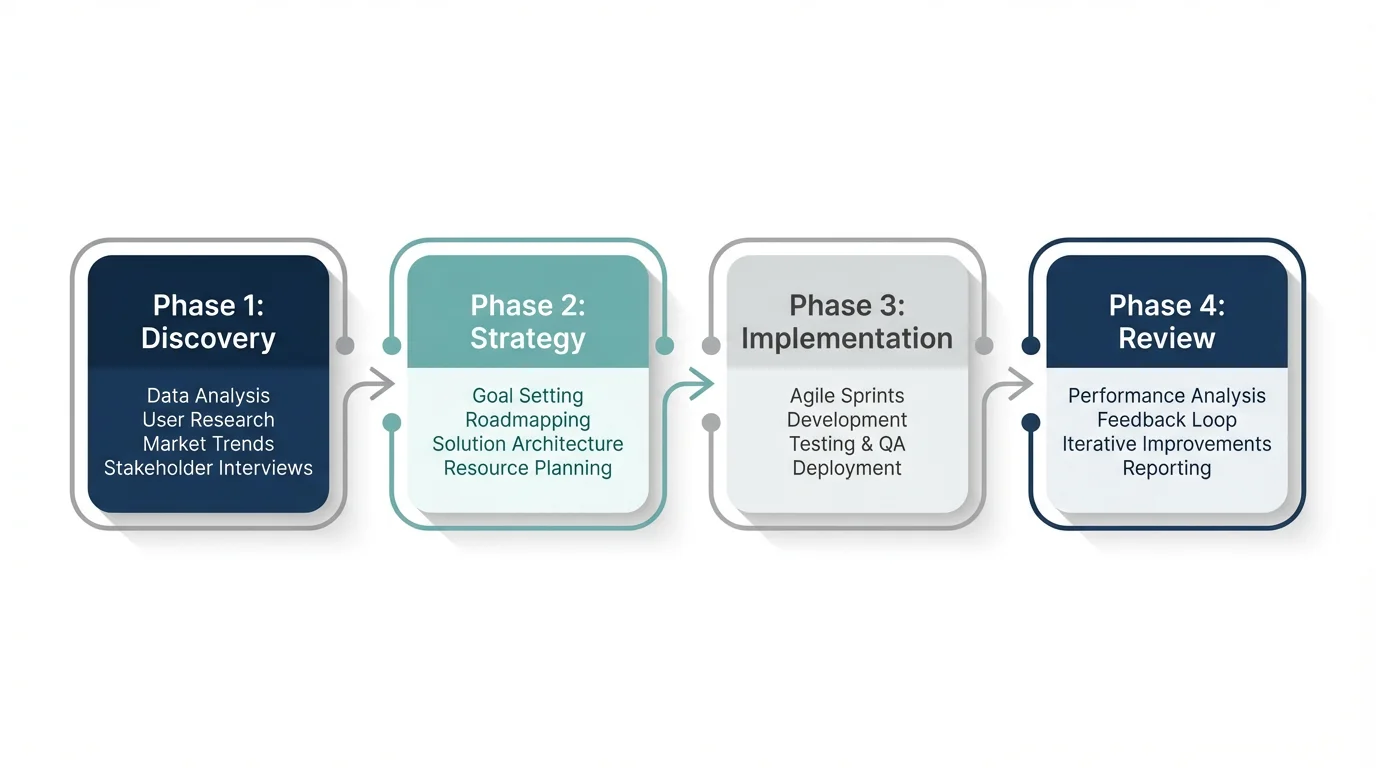
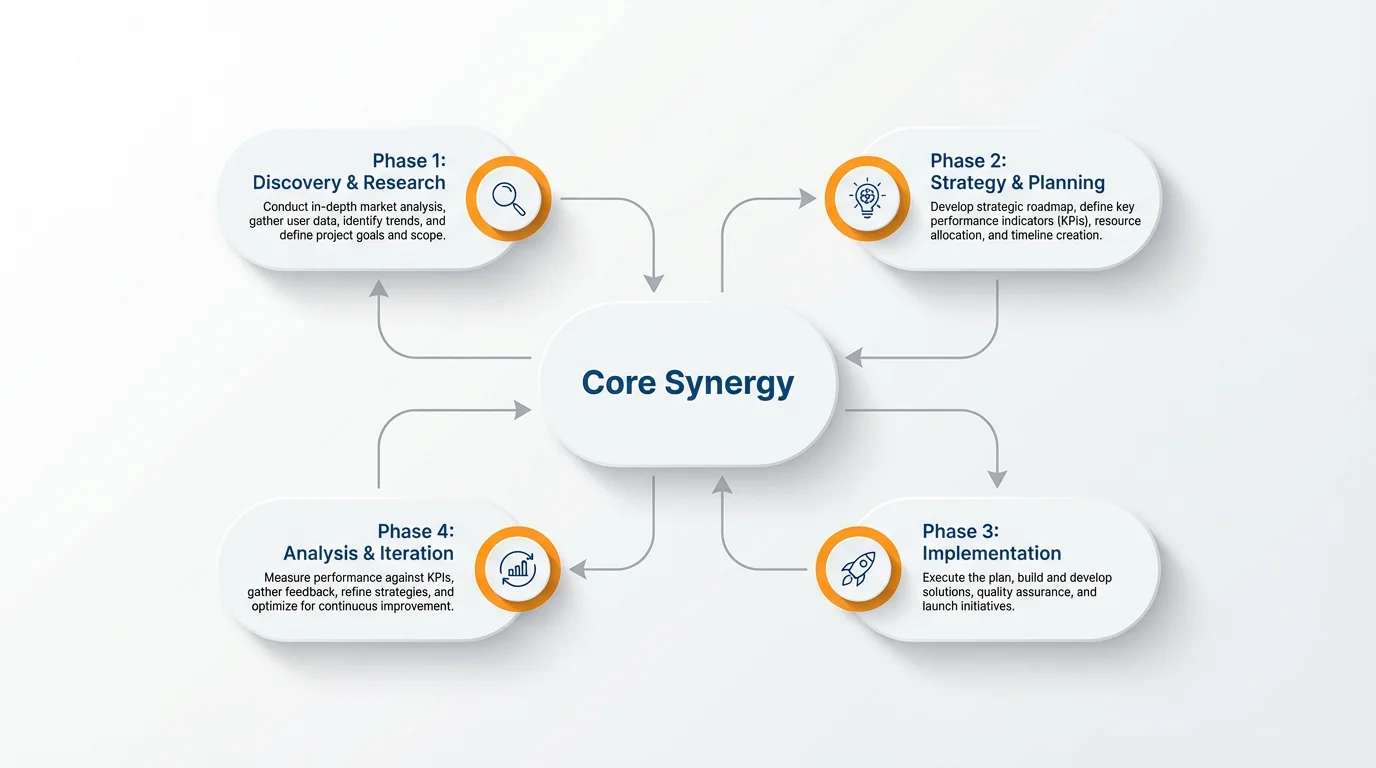
A good methodology diagram should include the key stages of your research. This typically starts with the research problem or questions, followed by literature review, research design, data collection methods, data analysis techniques, and finally, the interpretation of results or conclusions.
Yes, you can create diagrams for any research type. In your prompt, simply specify whether your study is qualitative, quantitative, mixed-methods, or follows another framework. You can instruct the AI to create separate branches or color-code sections for different methodologies.
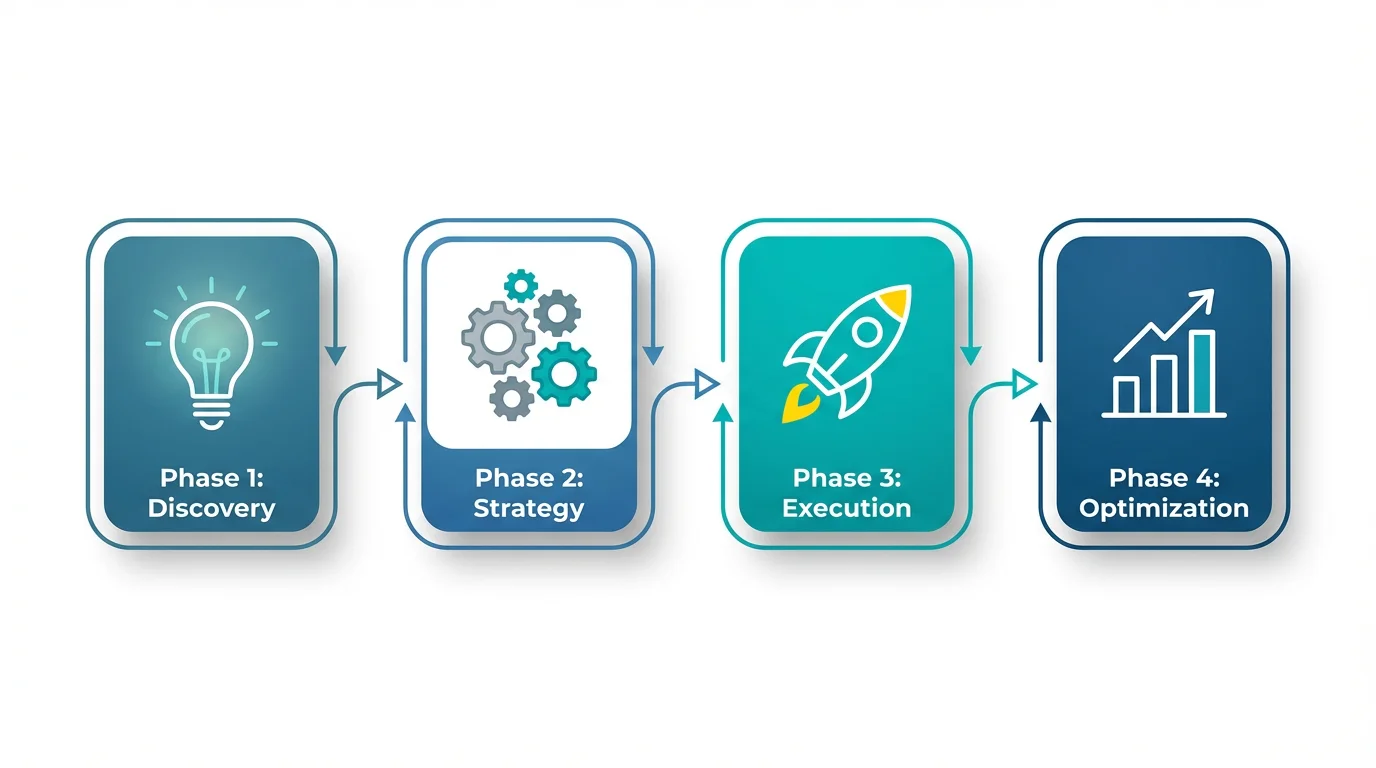
A methodology flowchart is important because it provides a clear, organized plan for your research. It helps you stay focused, ensures your process is systematic, and makes it easier for others, like professors or reviewers, to understand and evaluate the credibility of your work.
Absolutely. If you have a hand-drawn sketch or a basic digital draft, you can upload it. Then, in your text prompt, you can describe how you want the AI to refine it into a professional and polished methodology diagram.
Great app, easy to use. Helps our small business save time and money to create different marketing materials professionally. Thank you.
I need a good background remover for my work and I've been through them all it feels like. This one is the best by far. It's so easy to use and the results always look amazing. Thank you Pixelcut!
It's amazingly easy and gives the perfect results for my bags and accessories. It looks like it was done by a professional photographer.