My favorite app
Great app, easy to use. Helps our small business save time and money to create different marketing materials professionally. Thank you.
Start by writing a detailed prompt. Include the main problem, the categories for causes (like People, Process, etc.), and the specific causes for each.
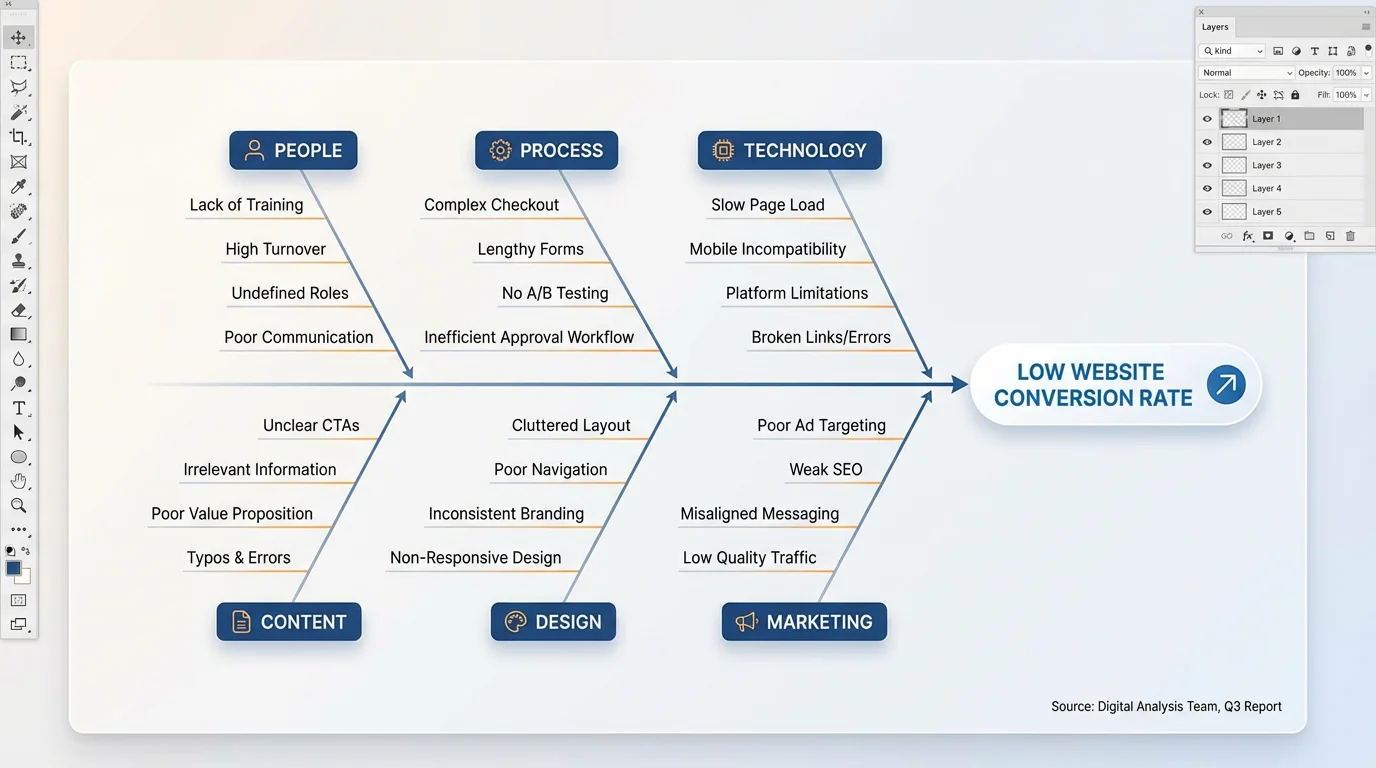
With a single click, our AI will take your text description and build a structured, easy-to-read fishbone diagram for you.
Your high-resolution cause and effect diagram is ready. Download it for free and use it in presentations, reports, or collaborative sessions.
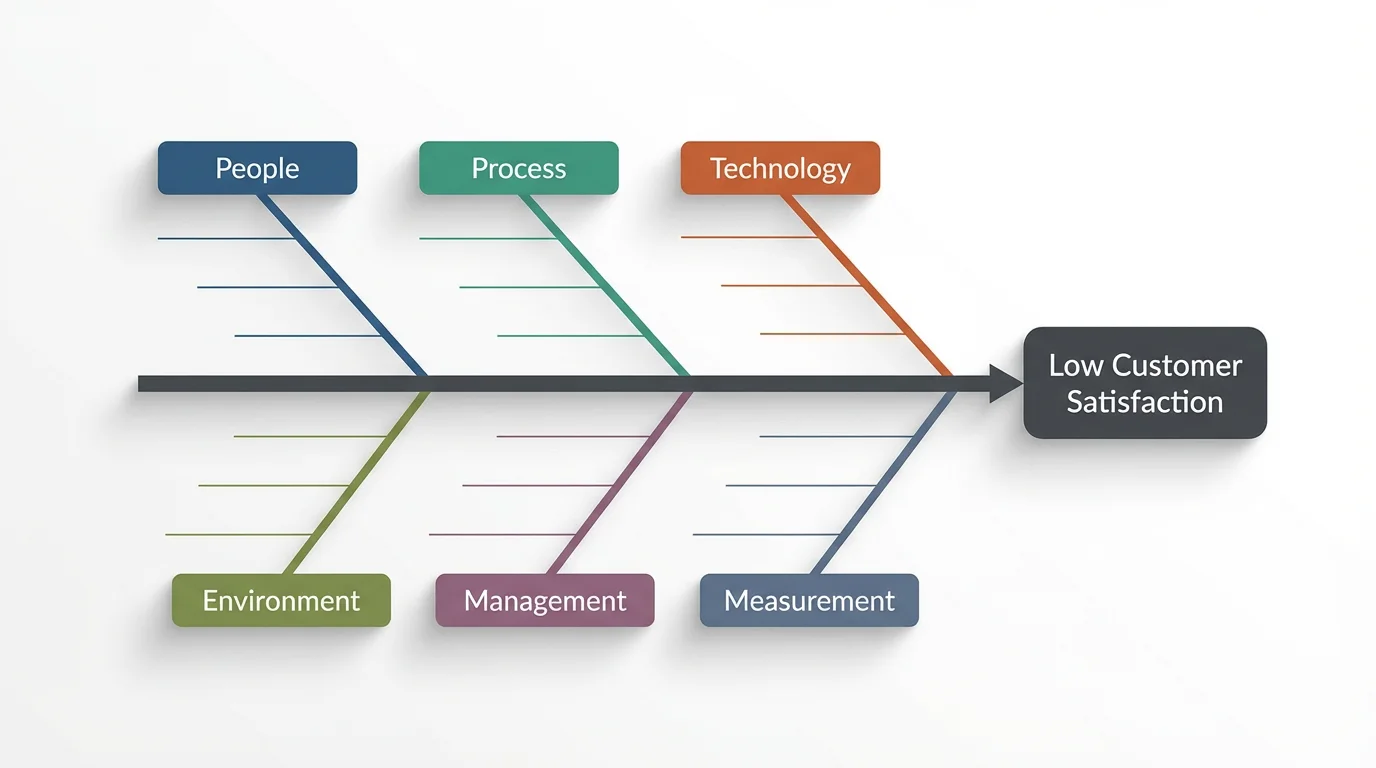
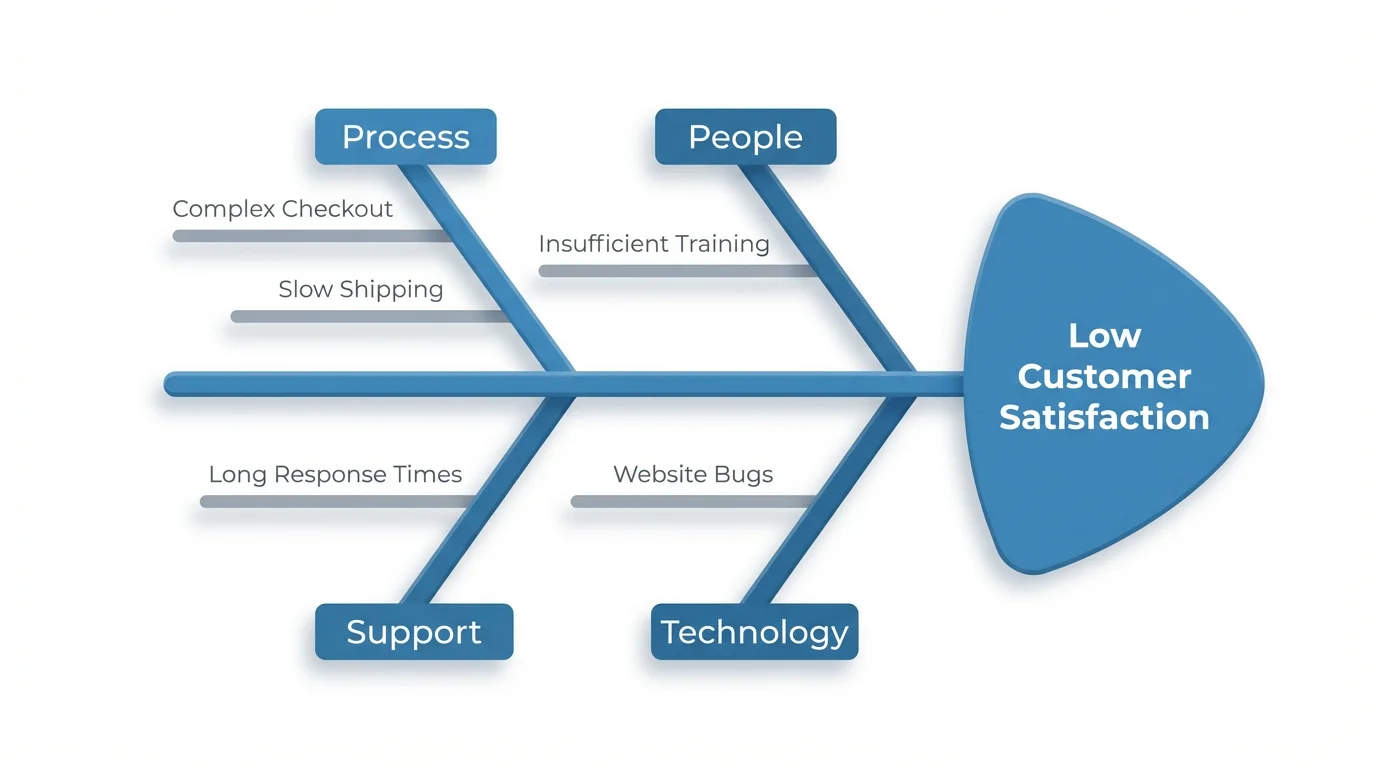
An AI fishbone diagram generator is a tool that uses artificial intelligence to automatically create a cause and effect diagram based on your text descriptions. You provide the problem statement, the main categories, and the potential causes, and the AI visualizes it for you in the classic fishbone structure.
Simply write a prompt describing the diagram you want. Start with the main problem (the 'head' of the fish), then list the main categories (the 'bones'), and finally add the specific causes for each category. The AI will interpret your text and generate the diagram for you to download.
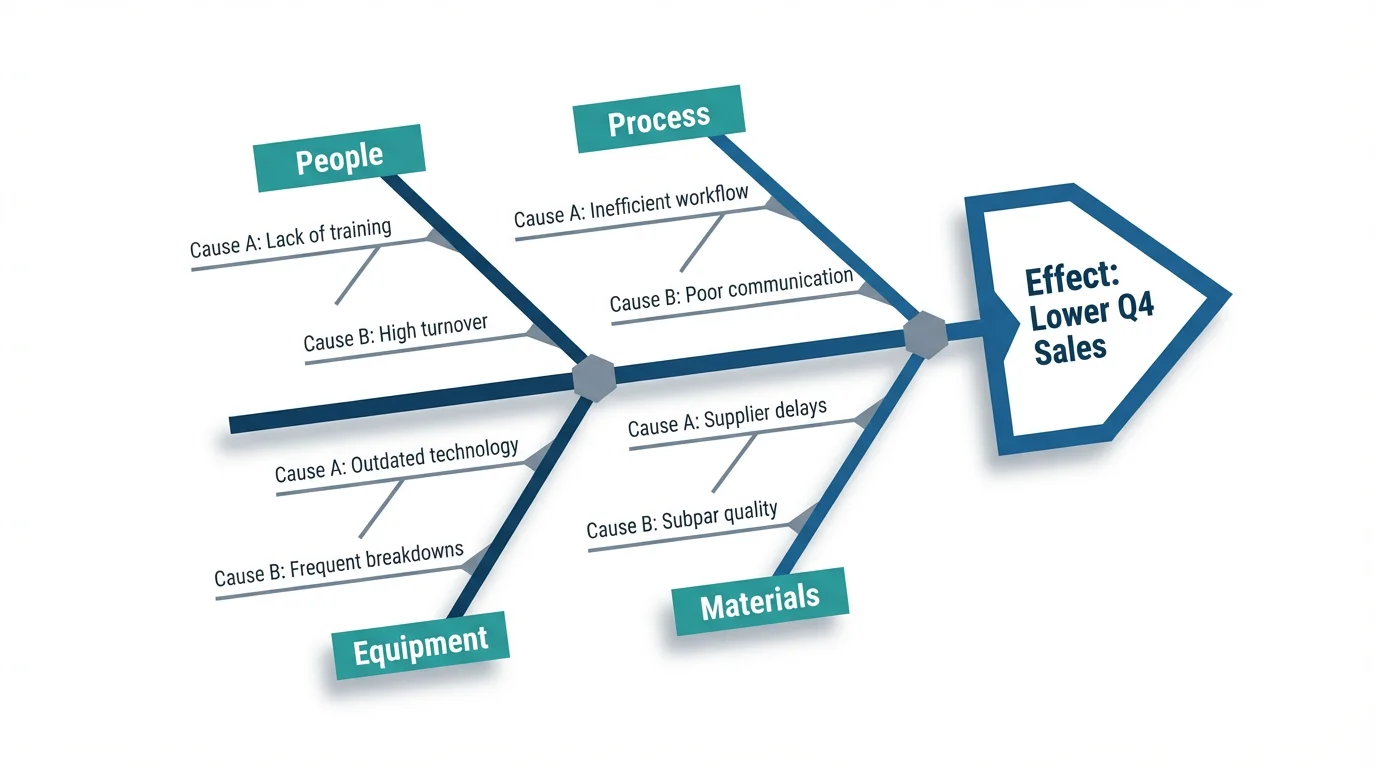
A fishbone diagram is also called an Ishikawa diagram, after its creator Kaoru Ishikawa, or a cause and effect diagram.
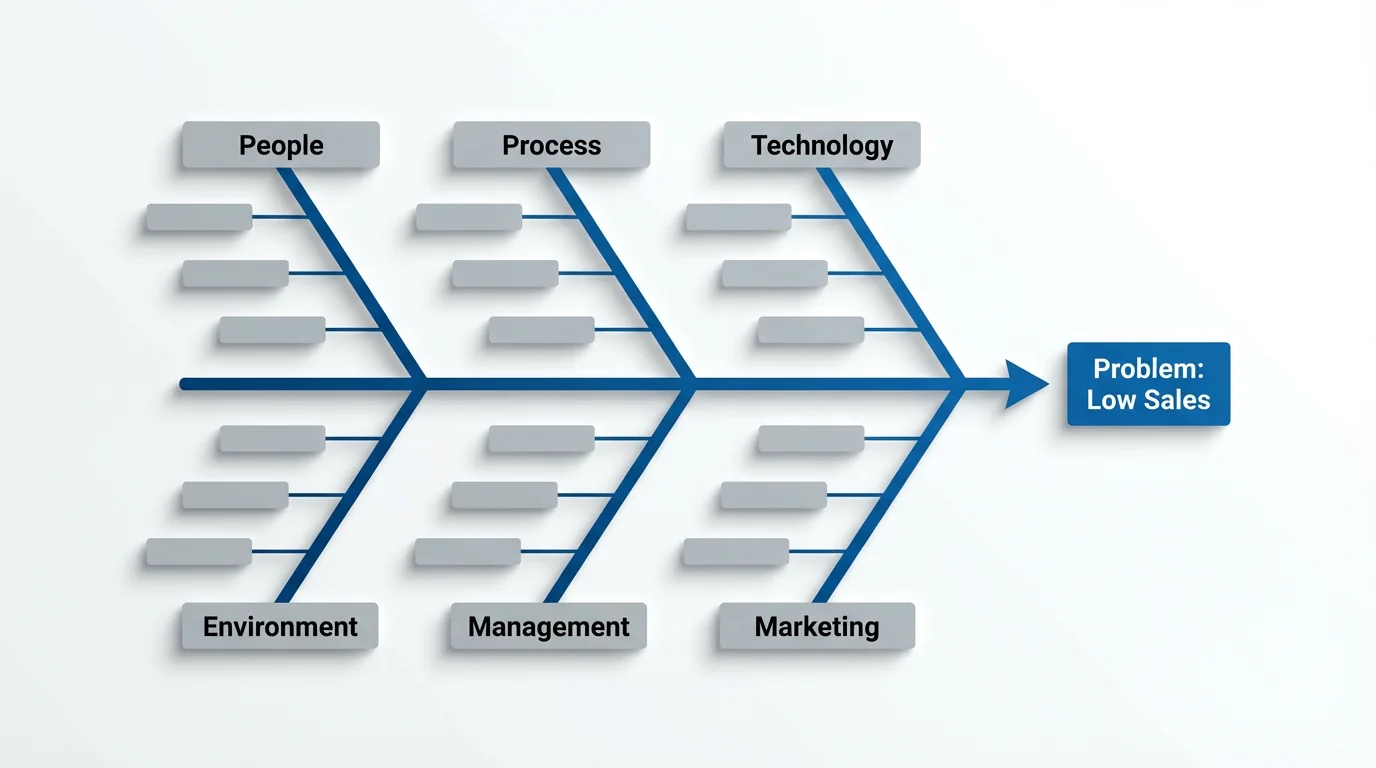
The 6Ms are a classic set of categories used in manufacturing for root cause analysis. They stand for Manpower, Method, Machine, Material, Measurement, and Mother Nature (Environment). Our tool allows you to use these or create your own custom categories.
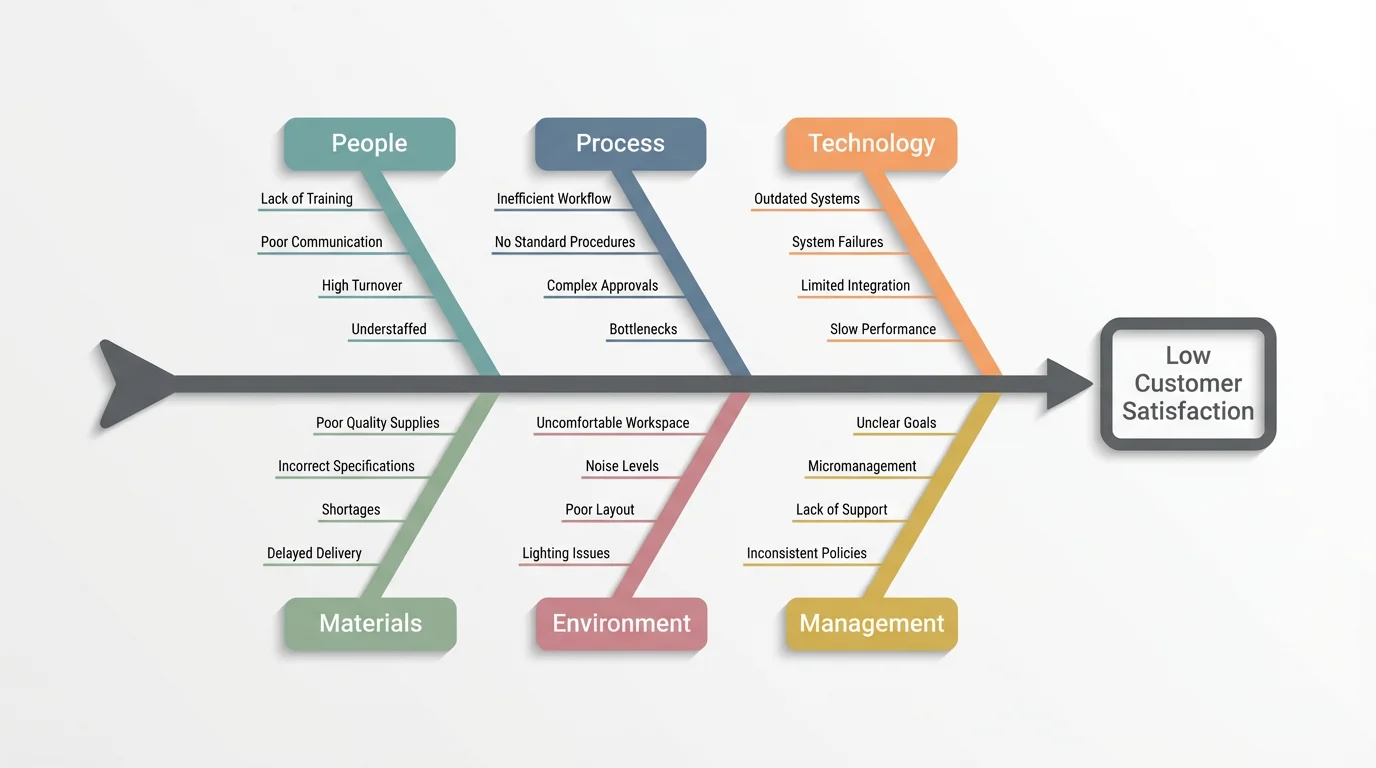
Yes, the fishbone diagram is a foundational tool for root cause analysis. By helping you visually map out all potential causes of a problem, it provides a structured way to brainstorm and identify where the core issues lie.
Yes, the tool is free to try. After using your initial free credits, you have the option to purchase more to continue creating diagrams.
You can download your finished fishbone diagrams in high-resolution PNG and JPEG formats for free. If you are a Pixelcut PRO user, you also have the option to download in SVG or WEBP formats.
Great app, easy to use. Helps our small business save time and money to create different marketing materials professionally. Thank you.
I need a good background remover for my work and I've been through them all it feels like. This one is the best by far. It's so easy to use and the results always look amazing. Thank you Pixelcut!
It's amazingly easy and gives the perfect results for my bags and accessories. It looks like it was done by a professional photographer.