My favorite app
Great app, easy to use. Helps our small business save time and money to create different marketing materials professionally. Thank you.
Start by uploading an image. This could be a wireframe, a sketch, or an old dashboard design you want to improve.
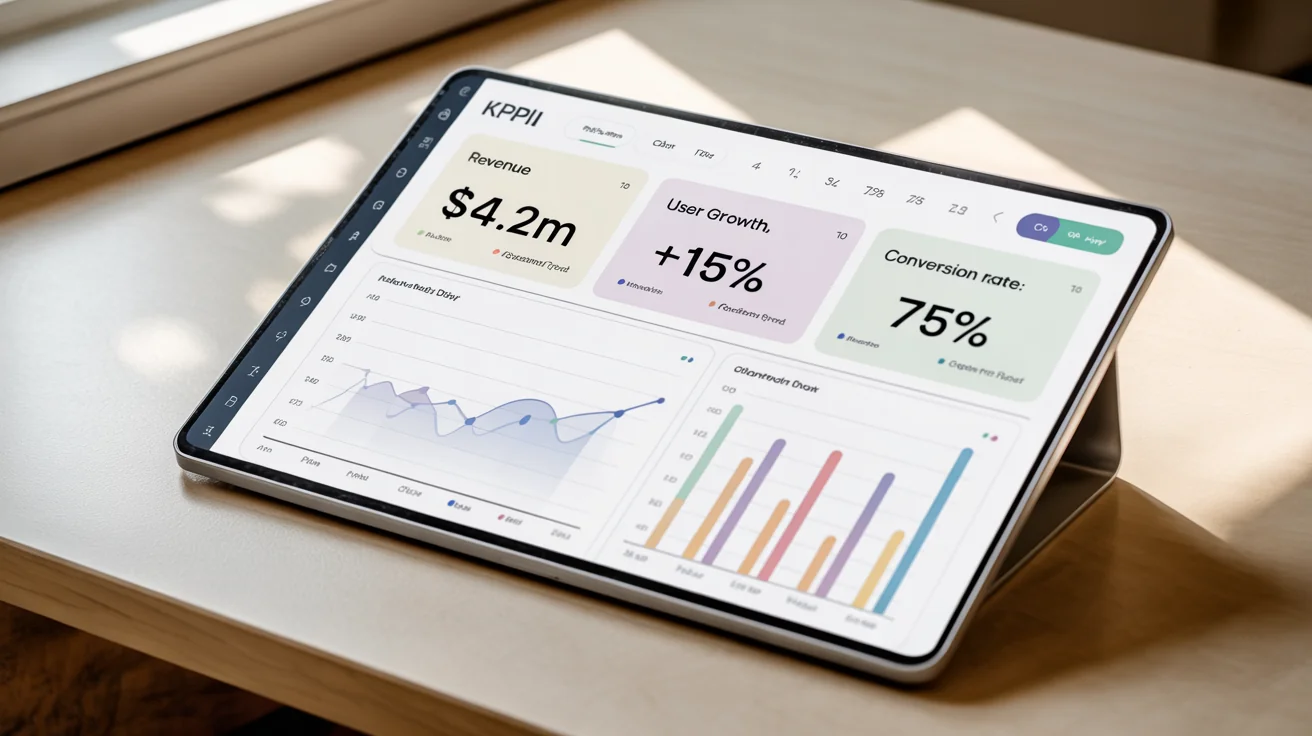
Describe your ideal dashboard. Mention key metrics, chart types, colors, and layout like 'a sales dashboard with a line chart for revenue and KPI cards'.
The AI will process your image and prompt to create a new, custom KPI dashboard design for you in seconds.
Your high-resolution KPI dashboard design is ready. Download the watermark-free PNG to use in your projects and presentations.
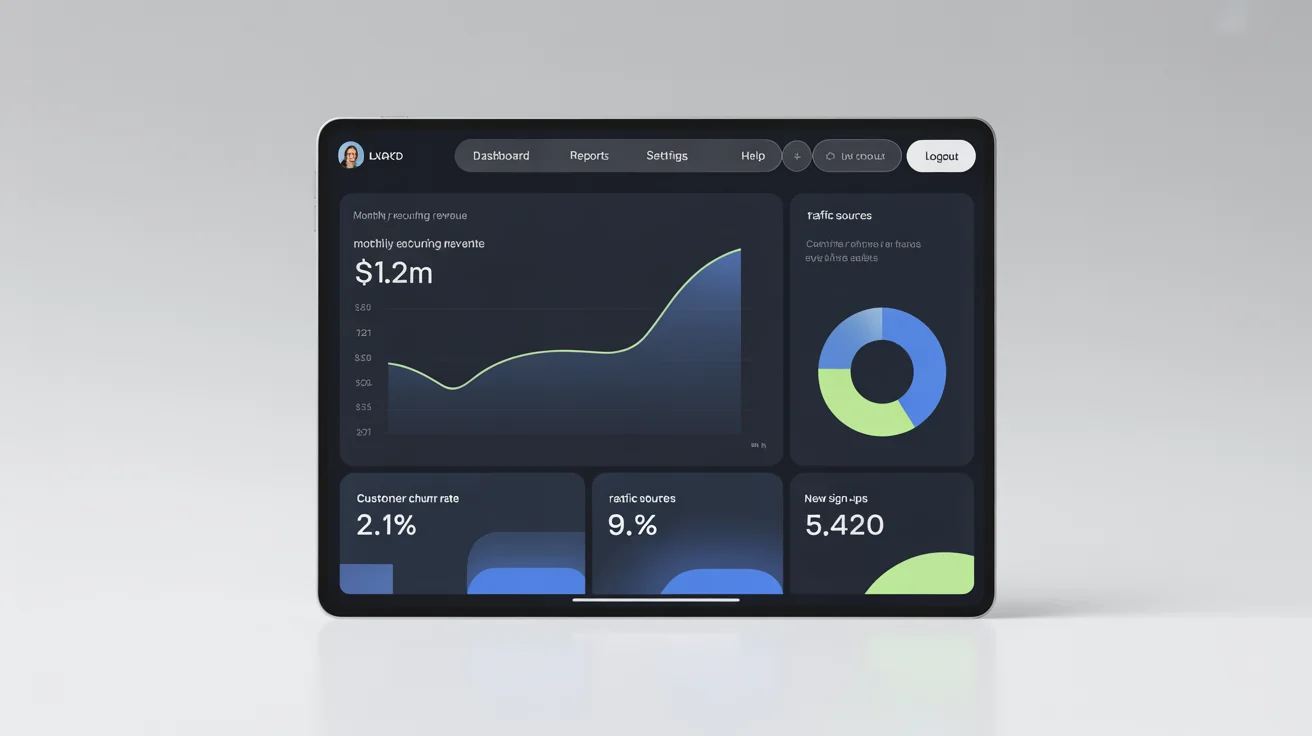
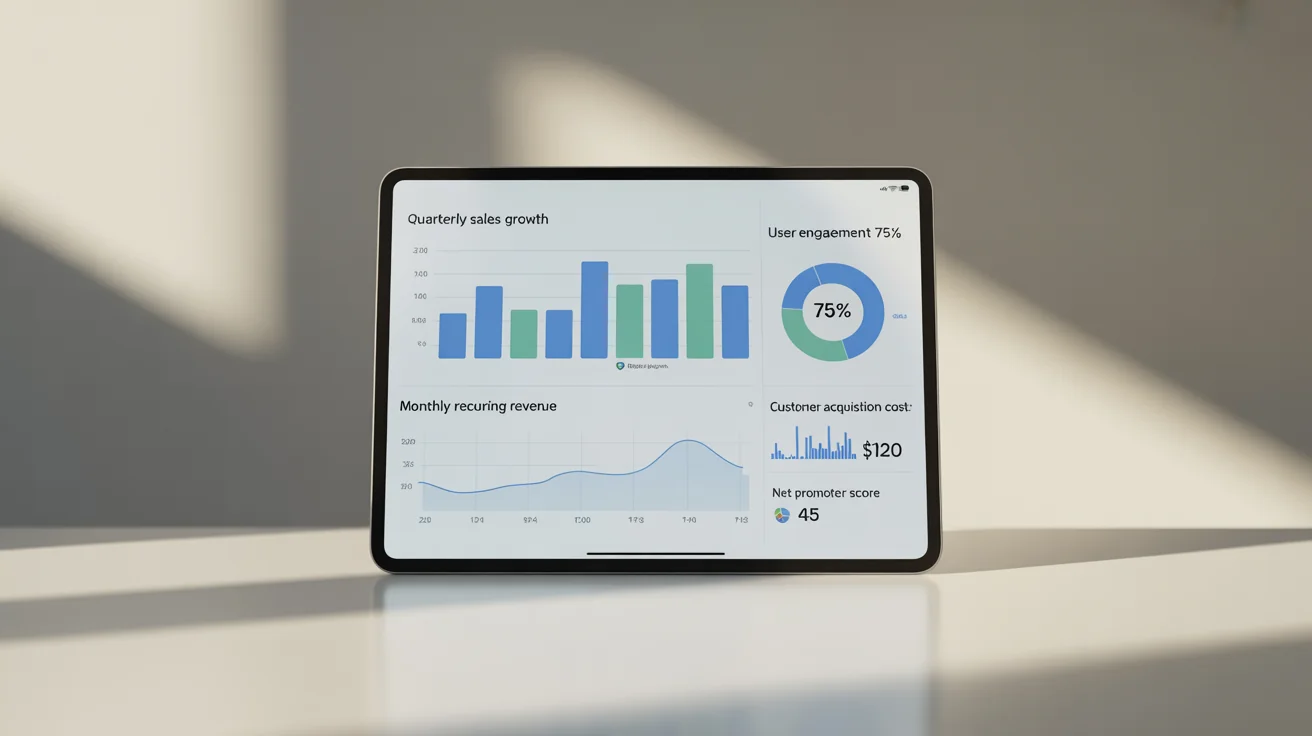


An AI KPI dashboard design generator is a tool that uses artificial intelligence to create visual mockups of Key Performance Indicator (KPI) dashboards from text descriptions. You describe the layout, metrics, charts, and style you want, and the AI generates a design for you.
Not at all. This tool is made for everyone, regardless of technical skill. You only need to provide a text prompt describing the dashboard you want to create. You can also upload a reference image, like a wireframe or an existing dashboard, to guide the AI.
This tool is a visual design generator, not a live business intelligence (BI) platform. It creates static, high-resolution images of dashboards based on your descriptions. It does not connect to live data sources. The designs can be used as a blueprint for development in a BI tool.
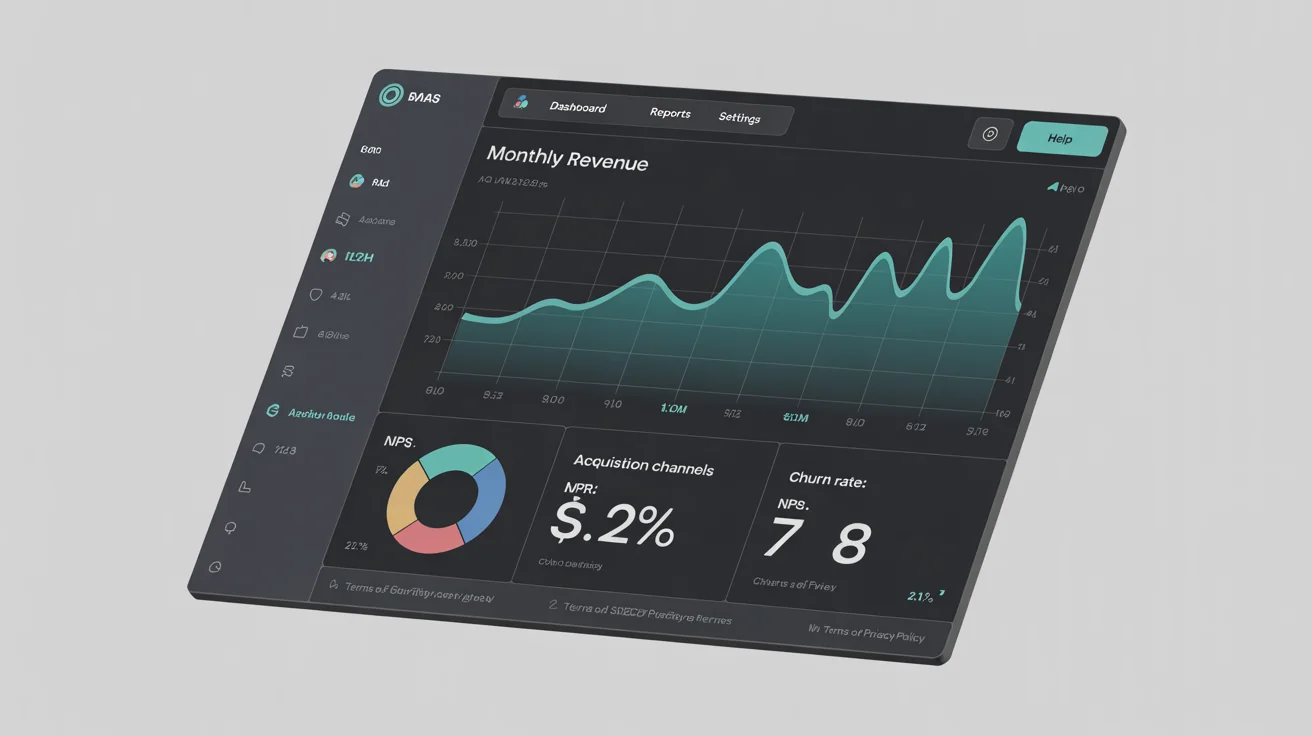
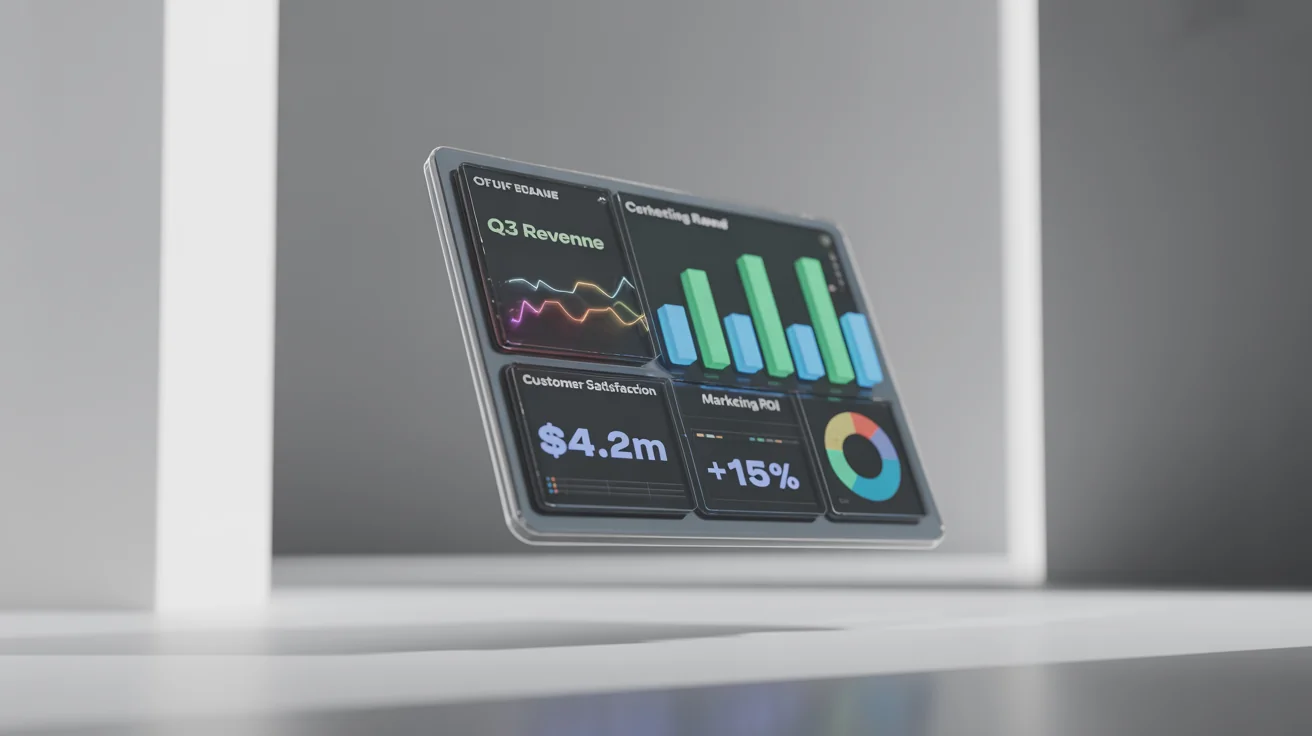
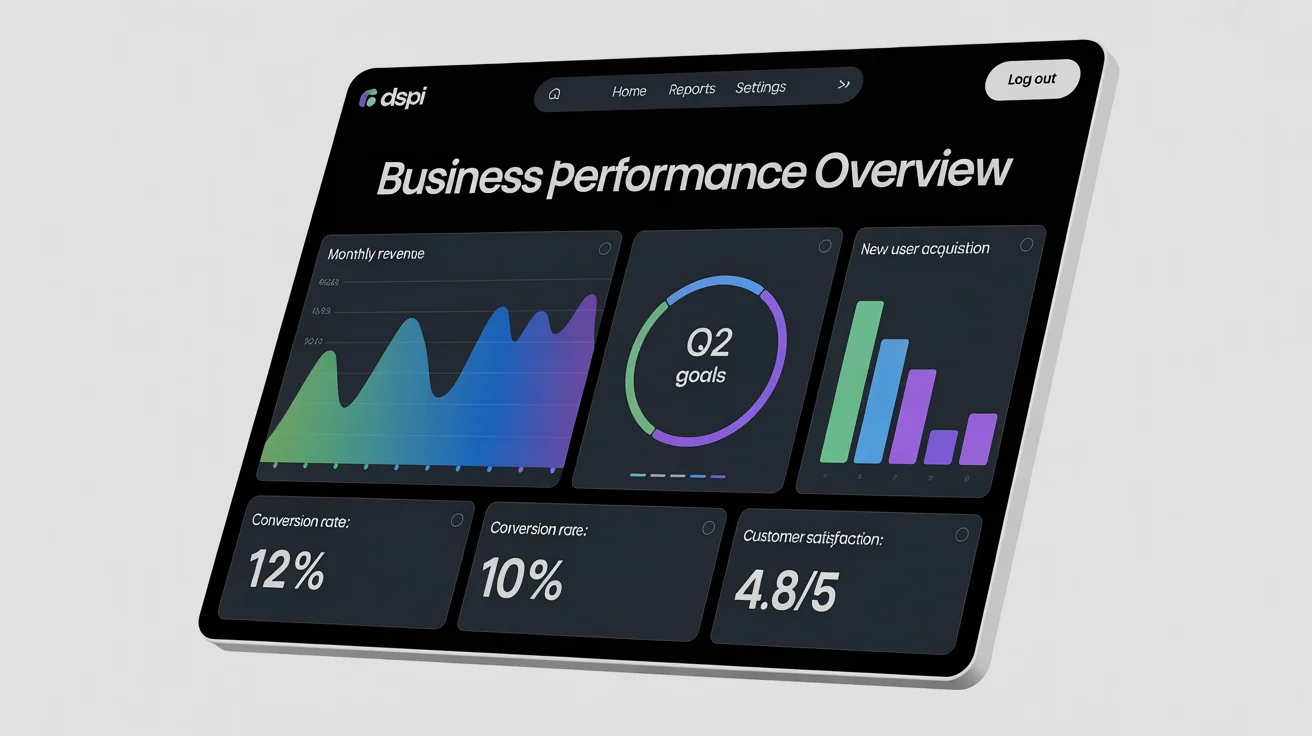
You can request various data visualization elements in your prompt. Describe what you need, such as line graphs for trends, bar charts for comparisons, pie charts for proportions, and KPI cards for key metrics. The more detailed your description, the closer the result will be to your vision.
Yes. In your prompt, you can specify brand colors, request a minimalist or a vibrant style, and even describe the overall aesthetic you want to achieve to ensure the generated design aligns with your company's branding.
You can use the high-resolution PNG image in presentations, reports, design mockups, or as a visual guide for your development team to build a functional dashboard. It’s a great way to quickly visualize and communicate your data strategy.
Great app, easy to use. Helps our small business save time and money to create different marketing materials professionally. Thank you.
I need a good background remover for my work and I've been through them all it feels like. This one is the best by far. It's so easy to use and the results always look amazing. Thank you Pixelcut!
It's amazingly easy and gives the perfect results for my bags and accessories. It looks like it was done by a professional photographer.